. 2015 Apr 13;209(1):33-46.
doi: 10.1083/jcb.201408017.

Excision of translesion synthesis errors orchestrates responses to helix-distorting DNA lesions

Affiliations

Excision of translesion synthesis errors orchestrates responses to helix-distorting DNA lesions

Anastasia Tsaalbi-Shtylik et al. J Cell Biol. .

Abstract

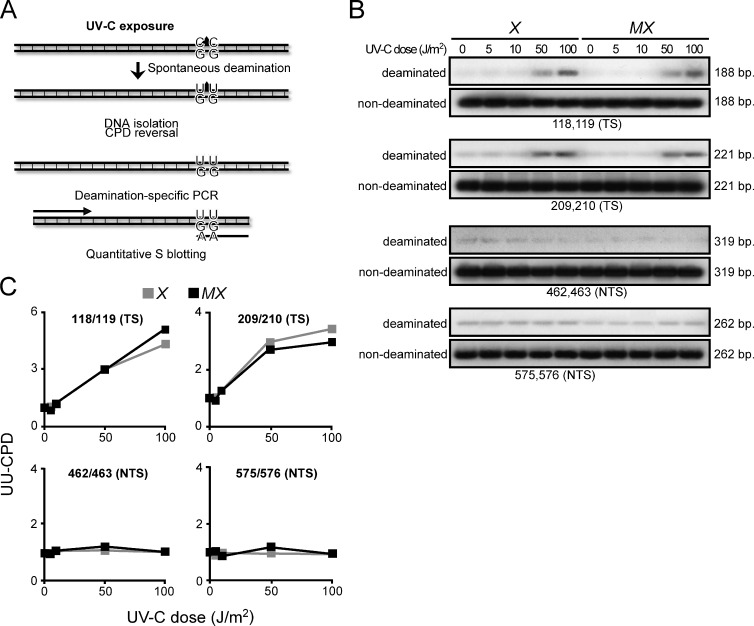
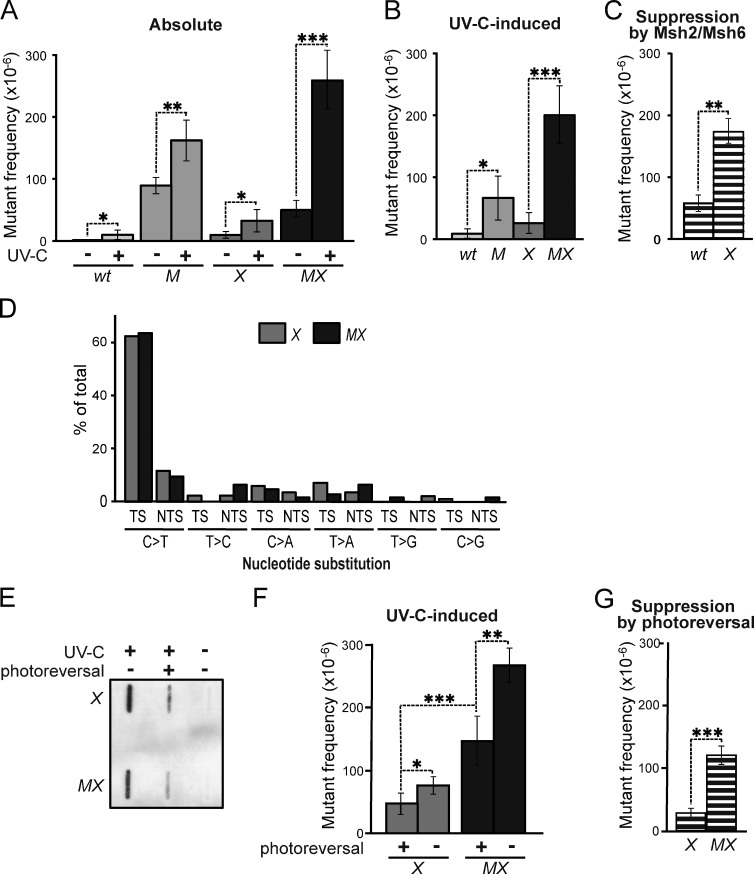
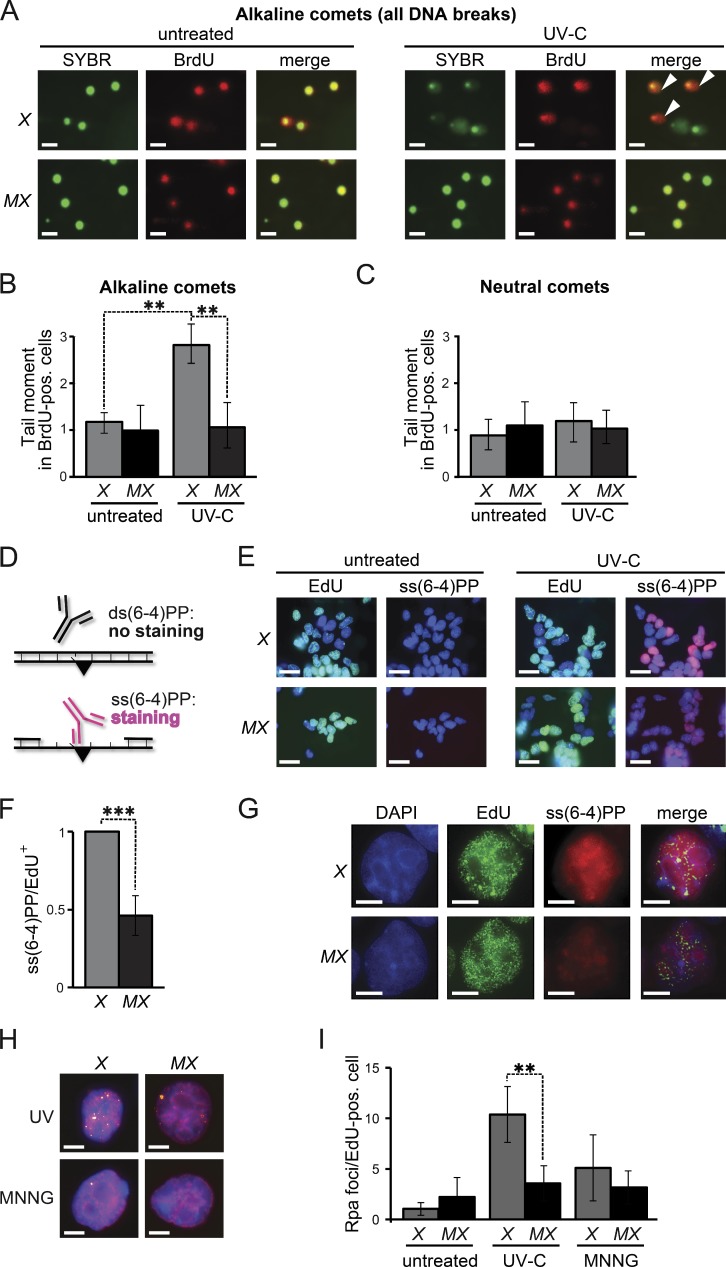
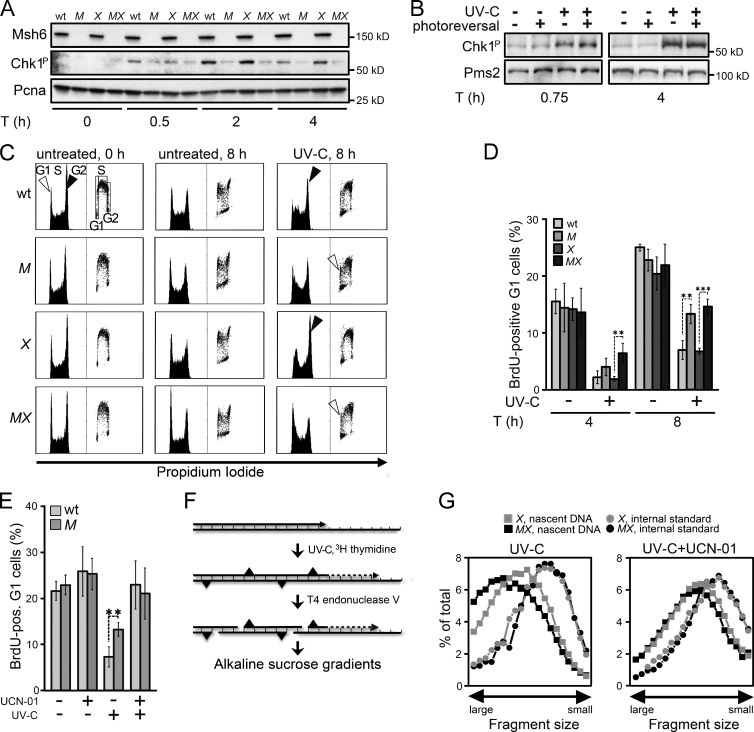
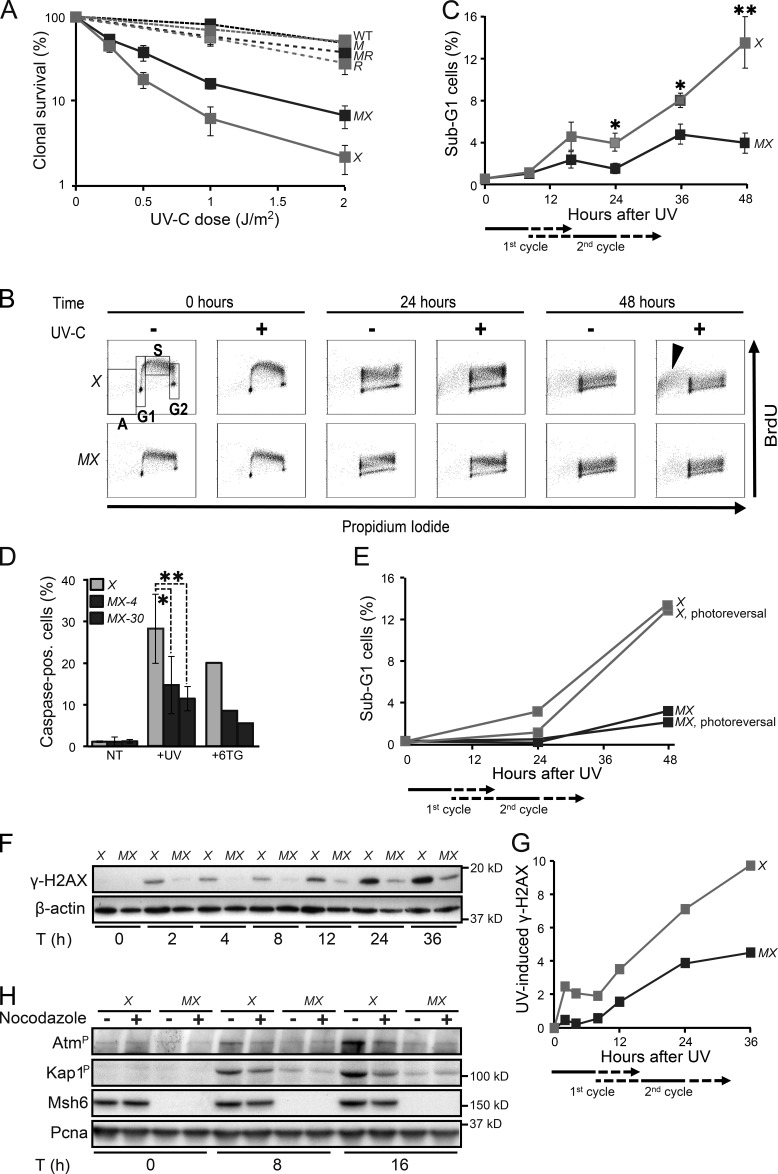
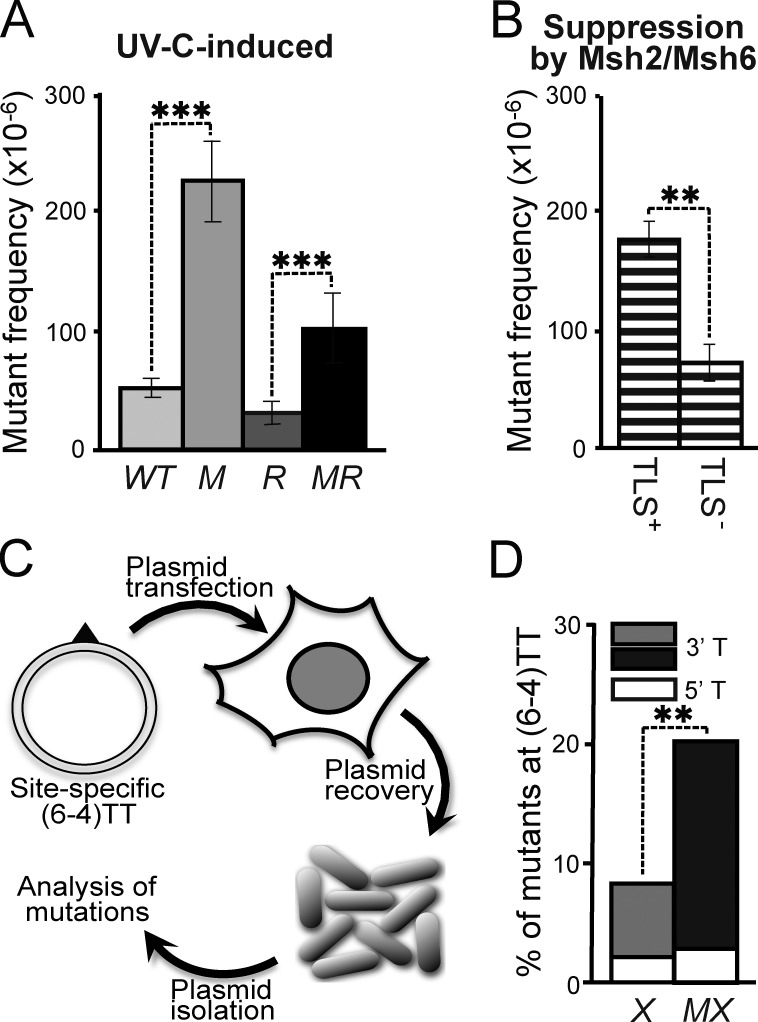
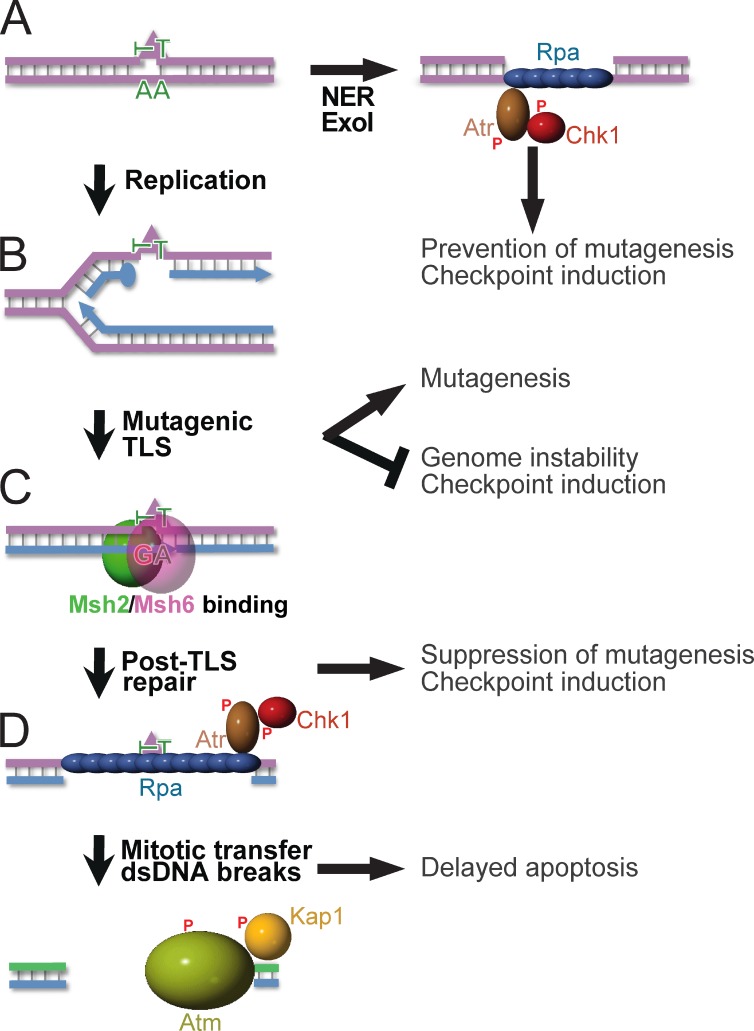
In addition to correcting mispaired nucleotides, DNA mismatch repair (MMR) proteins have been implicated in mutagenic, cell cycle, and apoptotic responses to agents that induce structurally aberrant nucleotide lesions. Here, we investigated the mechanistic basis for these responses by exposing cell lines with single or combined genetic defects in nucleotide excision repair (NER), postreplicative translesion synthesis (TLS), and MMR to low-dose ultraviolet light during S phase. Our data reveal that the MMR heterodimer Msh2/Msh6 mediates the excision of incorrect nucleotides that are incorporated by TLS opposite helix-distorting, noninstructive DNA photolesions. The resulting single-stranded DNA patches induce canonical Rpa-Atr-Chk1-mediated checkpoints and, in the next cell cycle, collapse to double-stranded DNA breaks that trigger apoptosis. In conclusion, a novel MMR-related DNA excision repair pathway controls TLS a posteriori, while initiating cellular responses to environmentally relevant densities of genotoxic lesions. These results may provide a rationale for the colorectal cancer tropism in Lynch syndrome, which is caused by inherited MMR gene defects.


Figures

Figure 1.
Figure 1.
Msh2/Msh6-dependent suppression of UVC-induced mutations is not related to ncMMR. (A) C’s within CPD lesions can deaminate spontaneously to U’s that instruct the mutagenic incorporation of adenines during replication. Excision of U-containing CPD by ncMMR might preclude their mutagenicity. Levels of site-specific UU-CPD at an ectopic Hprt minigene can be quantified, after photoreversal of the CPD in vitro, by PCR using primers with a 3′ AA dinucleotide and quantitative Southern blotting. Primers with a 3′ GG dinucleotide are used as standards (see Hendriks et al., 2010 for primer sequences). (B) Autoradiographs of Southern blots of PCR products, specific for the four tested UU-CPD. Numerals refer to the position in the Hprt cDNA. TS, UU-CPD at the transcribed strand; NTS, UU-CPD at the nontranscribed strand; X, Xpa−/−; MX, Msh6−/−Xpa−/−. (C) Quantification of deaminated CC-CPD from the autoradiographs shown in B, corrected for the standards.
Figure 2.
Figure 2.
Msh2/Msh6 acts independently of NER to suppress the mutagenicity of photolesions. (A) Frequencies of mutants at the genomic Hprt gene in isogenic WT, Msh6−/− (M), Xpa−/− (X), and Msh6−/−Xpa−/− (MX, line 4) ES cells after mock or low-dose UVC (0.75 J/m2), treatment. Bars represent averages of at least three independent experiments. See Fig. S1 for results using an independently derived Msh6−/−Xpa−/− ES cell line (line 30). (B) UVC-induced mutant frequencies in isogenic ES cell lines, derived from data in A. (C) Msh2/Msh6-dependent suppression of UVC-induced mutagenesis in NER-proficient (WT) and in NER-deficient (X) backgrounds. Frequencies were derived by subtraction of induced mutant frequencies in Msh6-proficient cells from those in Msh6-deficient cells (B) in each individual experiment, followed by averaging. (D) Relative frequencies of UVC (0.75 J/m2)-induced nucleotide substitutions at dipyrimidines in Xpa−/− (X) and Msh6−/−Xpa−/− (MX) ES cells, derived from Table S1. TS, dipyrimidine (photolesion site) located at the transcribed DNA strand; NTS, dipyrimidine at the nontranscribed DNA strand. (E) Slot blot illustrating photoreversal of the majority of CPD in UVC-treated (0.75 J/m2) ES cell lines. (F) UVC (0.75 J/m2)-induced mutant frequencies in Xpa−/− (X) and in Msh6−/−Xpa−/− (MX) ES cells, with or without CPD photoreversal. All frequencies were corrected for spontaneous mutant frequencies. Bars represent averages of three independent experiments. (G) Effect of CPD photoreversal on UVC-induced mutant frequencies in Xpa−/− (X) and in Msh6−/−Xpa−/− (MX) cells. Frequencies were calculated by subtraction of induced mutant frequencies in Msh6-proficient cells from those in Msh6-deficient cells (F) in each individual experiment, followed by averaging.
Figure 3.
Figure 3.
Msh2/Msh6-dependent, S-phase-associated, induction of ss(6–4)PP. (A) Alkaline comet assays of nocodazole-treated (mitotic) cells 16 h after UVC-treatment (0.75 J/m2). Nuclei are stained with SYBR green. BrdU-positive nuclei were replicating during exposure. Comets (white arrowheads) are representative of ssDNA breaks. X, Xpa−/− ES cells, MX, Msh6−/−Xpa−/− line 4. Bars, 10 µM. (B) Quantification of tail moments, representing ssDNA breaks, in BrdU-positive mitotic cells after alkaline electrophoresis. Bars represent averages of three independent experiments. (C) Quantification of tail moments, representing dsDNA breaks, in BrdU-positive mitotic cells after neutral electrophoresis. Bars represent averages of three independent experiments. (D) Immunostaining to detect ss(6–4)PP (black triangle). (E) Staining for ss(6–4)PP (magenta) in ES cell lines, UVC treated (2 J/m2) during replication (EdU-positive nuclei, green), at 4 h after exposure. X, Xpa−/− ES cells; MX, Msh6−/−Xpa−/− line 4. Blue, nuclear stain (DAPI). Bars, 10 µM. (F) Relative levels of ss(6–4)PP in EdU-positive nuclei at 4 h after UVC exposure. Values were corrected for the 0 h time point. The ss(6–4)PP level in Xpa−/− ES cells was set to 1. Bars represent averages of three independent experiments. (G) Partial co-localization of Msh2/Msh6-dependent ss(6–4)PP with EdU (replication foci; pulse-labeled immediately after UVC exposure). Cells were stained at 4 h after UVC exposure. In the merged panels, the brightness of the EdU channel was reduced slightly. Bars, 2.5 µM. (H) Chromatin-associated Rpa foci (yellow) at 8 h after treatment of replicating (EdU positive, magenta) cells with UVC (0.75 J/m2), or with MNNG (4 µM) to induce canonical MMR. Blue, nuclear stain (DAPI). Bars, 2.5 µM. (I) Quantification of the numbers of Rpa foci in EdU-positive nuclei, at 8 h after UVC or MNNG treatment. One representative experiment of in total three experiments is shown.
Figure 4.
Figure 4.
Requirement of Msh2/Msh6 for optimal checkpoint induction. (A) Immunoblot displaying Chk1 phosphorylation upon UVC (0.75 J/m2) exposure of ES cell lines. WT, WT ES cells; M, Msh6−/−; X, Xpa−/−; MX, Msh6−/−Xpa−/− line 4. Pcna, internal standard. Shown is a representative experiment of three independent experiments. See Fig. S3 A for one independent experiment. (B) Chk1 phosphorylation in UVC (0.75 J/m2)-treated Xpa−/− ES cells is not affected by photoreversal of CPD. The 45-min time point represents cells immediately after photoreversal. Pms2, internal standard. Shown is a representative experiment of three independent experiments. (C) Bivariate cytometry displaying cell cycle progression upon UVC exposure. NER-proficient ES cells were treated with 2 J/m2 UVC, NER-deficient cells with 0.75 J/m2 UVC. Exposure was immediately followed by pulse labeling of replicating cells with BrdU. Vertical axis, cell numbers (left) or BrdU staining intensity (right). M, Msh6−/−; X, Xpa−/−; MX, Msh6−/−Xpa−/− line 4. G1, G1 phase; S, S phase;, G2, G2/M phase. Filled arrowheads, accumulation at late S/G2/M phase. Open arrowheads, appearance of BrdU-positive cells at the G1 phase after UVC-exposure. A representative experiment of three independent experiments is shown. (D) Quantification of UVC-exposed BrdU-positive cells at G1 at 4 and 8 h after treatment from three independent experiments. M, Msh6−/−; X, Xpa−/−; MX, Msh6−/−Xpa−/− line 4. (E) Quantification of UVC-exposed BrdU-positive ES cells at G1, cultured for 8 h in the presence of the Chk1 inhibitor UCN-01. Bars represent averages from three independent experiments. M, Msh6−/−. (F) Assessment of maturation of nascent DNA strands at 4 h after UVC treatment. [14C]-labeled intra-CPD fragments in fractions from the gradients are derived from parental DNA, serving as internal standard. [3H]-labeled fragments in fractions from the gradients represent nascent DNA. (G) Maturation of nascent DNA strands of ES cell lines, cultured for 4 h after UVC (5 J/m2) treatment in the absence (left) or presence (right) of the Chk1 inhibitor UCN-01. X, Xpa−/−; MX, Msh6−/−Xpa−/− line 4. Depicted is a representative experiment from two independent experiments. See Fig. S3 E for a similar experiment, using the Atr inhibitor Caffeine.
Figure 5.
Figure 5.
Msh2/Msh6-dependent delayed apoptotic responses to UVC. (A) Clonal survival of ES cell lines used in this study in response to UVC. M, Msh6−/−; X, Xpa−/−; MX, Msh6−/−Xpa−/− line 4; R, Rev1B/B; MR, Msh6−/−Rev1B/B. Lines represent averages from three independent experiments. (B) Bivariate cytometry of cell cycle progression in isogenic ES cell lines after exposure to 0.75 J/m2 UVC or mock treatment, followed by pulse labeling with BrdU, at later time points. Cells were analyzed for DNA content (propidium iodide staining) and for cell cycle progression (BrdU staining). A, sub-G1 fraction; G1, G1 phase; S, early S phase; G2, late S/G2/M phase. Arrowhead, late-appearing sub-G1 population. See Fig. S4 for an independent experiment. X, Xpa−/−; MX, Msh6−/−Xpa−/− line 4. 10,000 cells were analyzed per data point. (C) Quantification of sub-G1 fractions (fractions A; Fig. 5 B). The progression of cells to the second cell cycle after treatment is deduced from the dilution of the BrdU signal (see also Figs. S2 and S4). X, Xpa−/−; MX, Msh6−/−Xpa−/− line 4. Lines represent averages from three independent experiments. (D) Identification of apoptotic cells by staining for activated caspases. Two independent Msh6−/−Xpa−/− ES cell lines (4 and 30) were tested. 6-thioguanine (6TG) was used as a positive control for the induction of delayed apoptosis by canonical MMR (Mojas et al., 2007). X, Xpa−/−; MX-4 and MX-30, Msh6−/−Xpa−/− lines 4 and 30, respectively. One experiment is shown from three independent experiments. (E) UVC (0.75 J/m2)-induced apoptosis is not mitigated by photoreversal of CPD. X, Xpa−/−; MX, Msh6−/−Xpa−/− line 4. One representative experiment is shown from three independent experiments. (F) Immunoblot displaying γ-H2AX levels in adherent cells upon UVC treatment (0.75 J/m2). β-actin, internal standard. X, Xpa−/−; MX, Msh6−/−Xpa−/− line 4. One representative experiment is shown from three independent experiments. G. Quantification of the Immunoblot depicted in Fig. 5F. The signals for γ-H2AX were normalized with respect to the corresponding signals for β-actin. X, Xpa−/−; MX, Msh6−/−Xpa−/− line 4. H. Msh2/Msh6-dependent induction of the dsDNA breaks markers phospho-Atm and phospho-Kap1 during the second cell cycle after low-dose (0.75 J/m2) UVC treatment. PCNA, internal standard. X, Xpa−/−; MX, Msh6−/−Xpa−/− line 4. One representative experiment is shown from three independent experiments.
Figure 6.
Figure 6.
Epistasis of mutagenic TLS and Msh2/Msh6. (A) UVC (2 J/m2)-induced mutant frequencies in isogenic WT, Msh6−/− (M), Rev1B/B (R), and Msh6−/−Rev1B/B (MR) ES cells. Bars represent averages from three independent experiments. (B) Msh2/Msh6-dependent suppression of UVC-induced mutant frequencies in Rev1-proficient (TLS+) and Rev1B/B (TLS) ES cells, derived from A. Frequencies were calculated by subtraction of induced mutant frequencies in Rev1B/B cells from those in Rev1B/BMsh6−/− cells in each individual experiment, followed by averaging. (C) In vivo assay to quantify mutagenic TLS at a site-specific (6–4)TT (triangle) on a transfected replicating plasmid. (D) Mutant frequencies at the 5′ and the 3′ thymidines of a site-specific (6–4)TT in NER-deficient (Xpc−/−) mouse embryonic fibroblast lines in the presence (X) or absence (MX) of Msh2/Msh6. Bars represent averages from two experiments (see Fig. S5).
Figure 7.
Figure 7.
Orchestration of diverse responses to low-dose UVC by post-TLS repair. P, Phosphate moieties A. NER repairs structurally aberrant DNA lesions (triangle). In nonreplicating cells, Exo1 can lengthen NER-induced excision tracts, provoking Rpa–Atr–Chk1-dependent checkpoint responses (Novarina et al., 2011; Sertic et al., 2011). (B) DNA lesions that escape NER arrest processive DNA polymerases δ or ε, necessitating postreplicative TLS for lesion bypass. By incorporating a nucleotide opposite the lesions, TLS precludes gross-genomic instability and the induction of checkpoints. The frequent incorporation of an incorrect nucleotide at poor or noninstructive lesions causes the inherent mutagenicity of TLS. (C) Msh2/Msh6 specifically recognizes incorrect nucleotides incorporated by TLS. This initiates their excision, which prevents mutagenesis. Persistent excision tracts by post-TLS repair opposite noninstructive lesions underlie the Rpa–Atr–Chk1-mediated intra-S checkpoint. (D) Excision tracts that are transferred to the subsequent cell cycle collapse to dsDNA breaks, reflected by autophosphorylation of Atm and by Atm-dependent phosphorylation of Kap1. We hypothesize that these dsDNA breaks originate from replicative runoff at the gap within the template, and are causative of the delayed Msh2/Msh6-dependent apoptosis.

Comment in

  • When mismatch repair met translesion synthesis.
    Tsaalbi-Shtylik A, Jansen JG, de Wind N. Tsaalbi-Shtylik A, et al. Cell Cycle. 2015 Aug 3;14(15):2377-8. doi: 10.1080/15384101.2015.1063288. Epub 2015 Jun 23. Cell Cycle. 2015. PMID: 26102362 Free PMC article. No abstract available.

References

    1. Avkin S., Sevilya Z., Toube L., Geacintov N., Chaney S.G., Oren M., and Livneh Z.. 2006. p53 and p21 regulate error-prone DNA repair to yield a lower mutation load. Mol. Cell. 22:407–413 10.1016/j.molcel.2006.03.022 - DOI - PubMed
    1. Bai H., Madabushi A., Guan X., and Lu A.-L.. 2010. Interaction between human mismatch repair recognition proteins and checkpoint sensor Rad9-Rad1-Hus1. DNA Repair (Amst.). 9:478–487 10.1016/j.dnarep.2010.01.011 - DOI - PMC - PubMed
    1. Bebenek K., Matsuda T., Masutani C., Hanaoka F., and Kunkel T.A.. 2001. Proofreading of DNA polymerase eta-dependent replication errors. J. Biol. Chem. 276:2317–2320 10.1074/jbc.C000690200 - DOI - PubMed
    1. Beukers R., Eker A.P.M., and Lohman P.H.M.. 2008. 50 years thymine dimer. DNA Repair (Amst.). 7:530–543 10.1016/j.dnarep.2007.11.010 - DOI - PubMed
    1. Boland C.R., and Goel A.. 2010. Microsatellite instability in colorectal cancer. Gastroenterology. 138:2073–2087: e3 10.1053/j.gastro.2009.12.064 - DOI - PMC - PubMed

Publication types