. 2015 Jun;35(12):2103-18.
doi: 10.1128/MCB.01370-14. Epub 2015 Apr 13.

TAF10 Interacts with the GATA1 Transcription Factor and Controls Mouse Erythropoiesis

Affiliations

TAF10 Interacts with the GATA1 Transcription Factor and Controls Mouse Erythropoiesis

Petros Papadopoulos et al. Mol Cell Biol. 2015 Jun.

Abstract

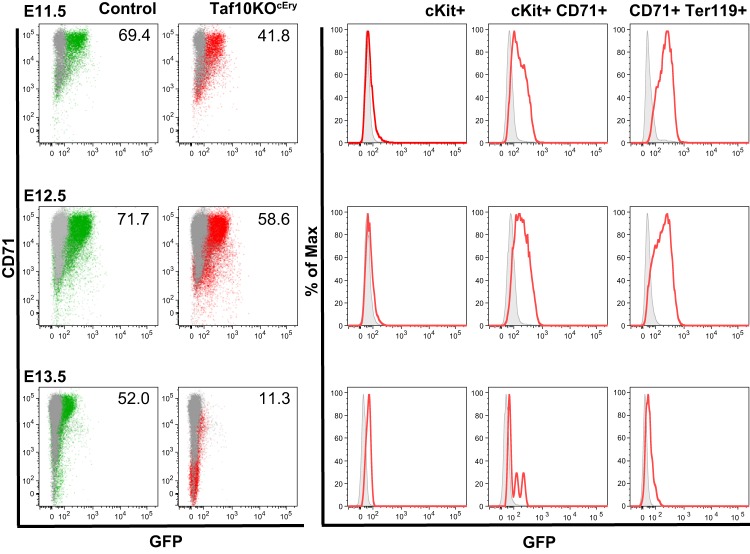
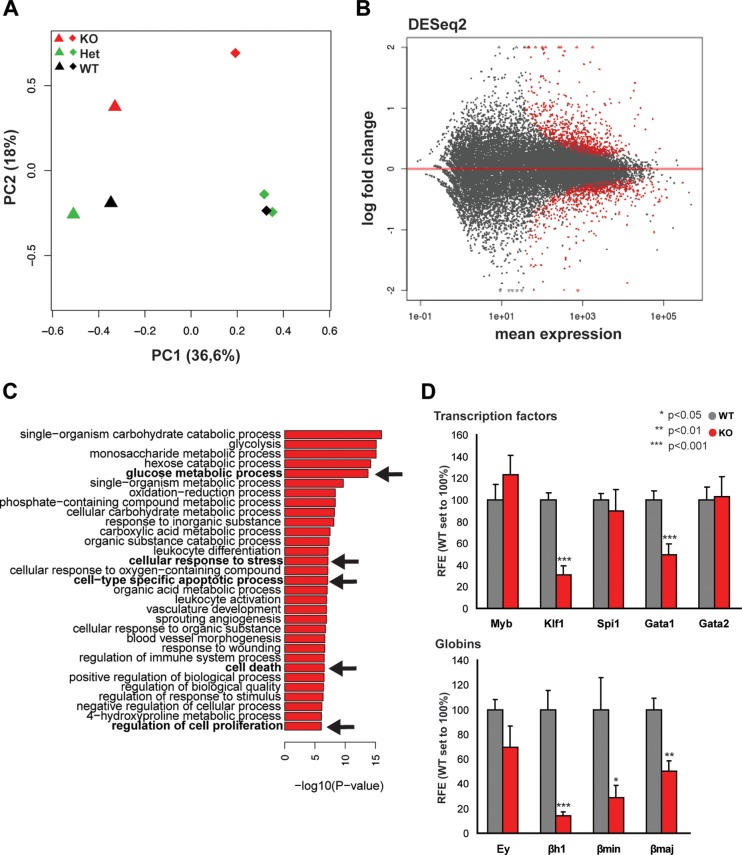
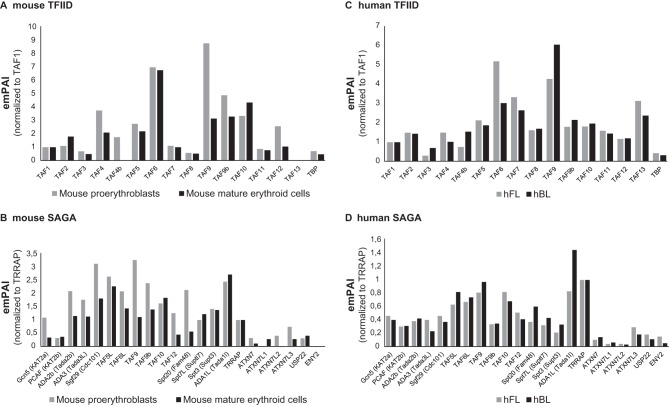
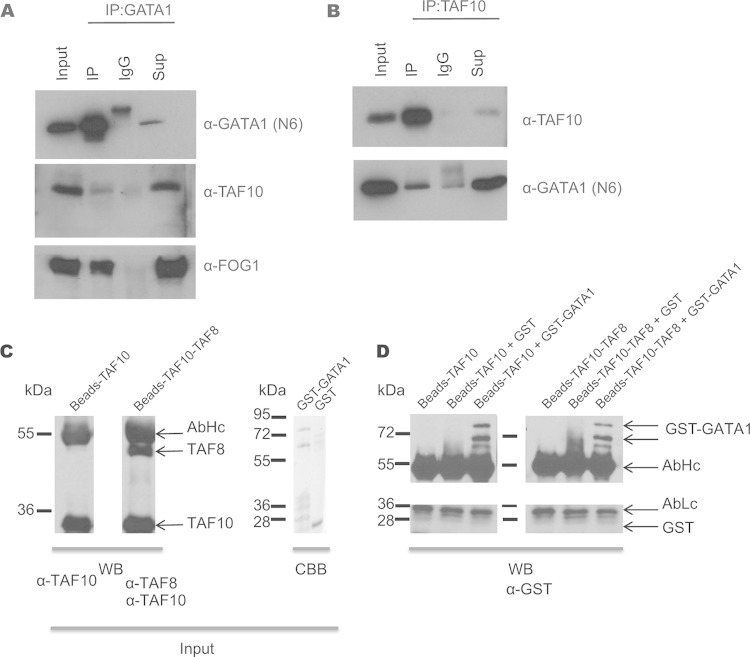
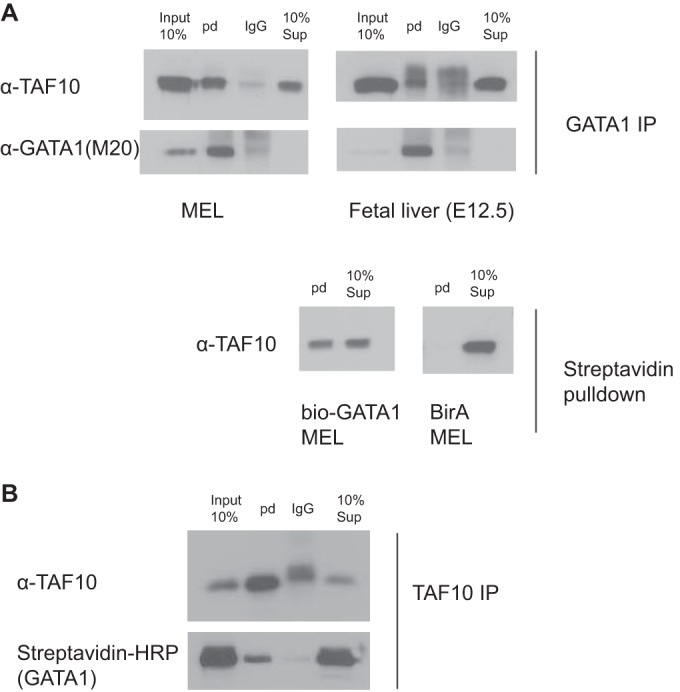
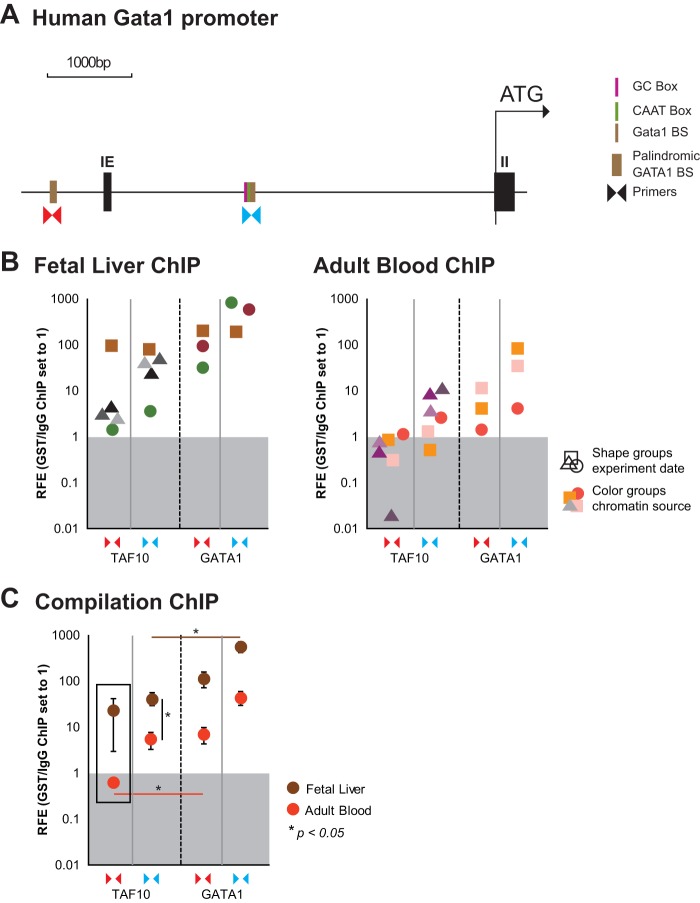
The ordered assembly of a functional preinitiation complex (PIC), composed of general transcription factors (GTFs), is a prerequisite for the transcription of protein-coding genes by RNA polymerase II. TFIID, comprised of the TATA binding protein (TBP) and 13 TBP-associated factors (TAFs), is the GTF that is thought to recognize the promoter sequences allowing site-specific PIC assembly. Transcriptional cofactors, such as SAGA, are also necessary for tightly regulated transcription initiation. The contribution of the two TAF10-containing complexes (TFIID, SAGA) to erythropoiesis remains elusive. By ablating TAF10 specifically in erythroid cells in vivo, we observed a differentiation block accompanied by deregulated GATA1 target genes, including Gata1 itself, suggesting functional cross talk between GATA1 and TAF10. Additionally, we analyzed by mass spectrometry the composition of TFIID and SAGA complexes in mouse and human cells and found that their global integrity is maintained, with minor changes, during erythroid cell differentiation and development. In agreement with our functional data, we show that TAF10 interacts directly with GATA1 and that TAF10 is enriched on the GATA1 locus in human fetal erythroid cells. Thus, our findings demonstrate a cross talk between canonical TFIID and SAGA complexes and cell-specific transcription activators during development and differentiation.


Figures

FIG 1
FIG 1
Developmental analysis of TAF10KOcEry. (A) Representative pictures of control and TAF10KOcEry embryos at E12.5. TAF10KOcEry embryos are pale, and the fetal livers of TAF10KOcEry embryos are much smaller than those of the control embryos. (B) Cell counts at E13.5 from fetal liver and embryonic blood of control and TAF10KOcEry embryos. (C) Flow cytometry analysis of single-cell suspensions of fetal liver from control and TAF10KOcEry embryos at different developmental stages (E11.5, E12.5, and E13.5). Numbers on the right indicate the percentages of live cells (Hoechst negative).
FIG 2
FIG 2
Flow cytometry of TAF10KOcEry fetal liver cells during gestation. Representative flow cytometry analysis of single-cell suspensions from the livers of control and TAF10KOcEry embryos at E11.5, E12.5, and E13.5 following the differentiation of erythroid cells. (A) Staining with KIT and CD71 markers (numbers indicate the percentages of gated live cells); (B) staining with CD71 and Ter119 markers (numbers indicate the percentages of gated live cells); (C) MFIs of KIT, CD71, and Ter119 populations expressed during development of erythroid cells of control and TAF10KOcEry fetal liver cells.
FIG 3
FIG 3
Analysis of EpoR-Cre transgenic expression. Fetal liver cells were analyzed by flow cytometry following the expression of GFP in frame with Cre recombinase in EpoR-Cre mice. Expression of GFP confined to the erythroid cell compartment was detected initially in KIT+ CD71+ cells at E11.5 (green population, controls; red population, TAF10KOcEry erythroid cells). Erythroid cells were affected in TAF10KOcEry embryos, and that is why the percentage (the numbers shown in the graphs) of CD71+ GFP+ cells is lower than that of control cells at E12.5. By E13.5 most of the cells were dead.
FIG 4
FIG 4
Analysis of gene expression in TAF10KOcEry fetal livers at E12.5. (A) PCA plot of the first two components of the fetal liver samples (from TAF10KOcEry mice [KO], heterozygous TAF10KO mice [Het], and WT mice) analyzed by RNA-seq. The variance explained by each component is depicted in parentheses on the axes. (B) MA plot of the mean normalized gene count versus the log2 fold changes in gene expression in TAF10KOcEry mice compared with that in WT and heterozygous TAF10KO mice. Genes are plotted as black circles. Genes with an adjusted P value (FDR) of <0.01 are colored red. Genes that fall out of the window boundaries of −2 or 2 log2 fold change are plotted as open triangles. (C) GO analysis of the upregulated genes in the TAF10KOcEry fetal livers. Metabolic pathways, cell-type-specific apoptotic and cell death-related processes, and proliferation were among the most affected and are indicated in boldface and with arrows. (D) qRT-PCR of total mRNA of fetal liver cells at E12.5. The expression levels of transcription factors and globin genes are depicted. Bars represent standard errors of the means (SEMs). RFE, relative fold enrichment.
FIG 5
FIG 5
Analysis of expression of transcription factor, erythroid cell-related, and globin genes. (A) Expression levels (in number of FPKM), determined by RNA-seq, of downregulated erythroid cell-related genes with q values of <0.05 and GATA1 binding peaks found within 10 kb of their TSSs. CTRL, control. (B) Expression levels (in number of FPKM), determined by RNA-seq, of upregulated genes with q values of <0.05 and GATA1 binding peaks found within 10 kb of their TSSs. (C) Deregulated genes with q values of >0.05 and GATA1 binding peaks found within 10 kb of their TSSs. (D) Venn diagram of deregulated genes. Upregulated, genes upregulated in TAF10KOcEry fetal liver cells identified by RNA-seq analysis (q value, <0.05); Downregulated, genes downregulated in TAF10KOcEry fetal liver cells identified by RNA-seq analysis (q value, <0.05); Gata1, GATA1 target genes described previously (40). Half of the deregulated genes have at least one GATA1 binding peak at locations within 10 kb of their TSSs.
FIG 6
FIG 6
Mass spectrometry of TFIID and SAGA complexes in mouse and human erythroid cells. (A and B) TAF10-containing TFIID (A) and SAGA (B) complexes were isolated by TAF10 immunoprecipitation from protein extracts prepared from immature and differentiating (mature) mouse erythroid cells and analyzed by mass spectrometry. The relative abundance (emPAI) values of the different subunits in the isolated complexes were first normalized by comparing the abundance values of all the subunits of TFIID to those for TAF1 or the abundance values of all the subunits of SAGA to those of TRRAP. TAF1 and TRRAP are the largest subunits in each complex. (C and D) Similarly, TAF10-containing TFIID (C) and SAGA (D) complexes were isolated by TAF10 immunoprecipitation from protein extracts prepared from hFL and hPB cells and analyzed by mass spectrometry. The emPAI values presented were normalized as described for the mouse samples.
FIG 7
FIG 7
Immunoprecipitation of TAF10 and GATA1 in MEL cells. (A) GATA1 immunoprecipitation in MEL cells. Anti-GATA1 antibody (N6) was used for Western blot analysis. TAF10 and FOG1 are coimmunoprecipitated. (B) TAF10 immunoprecipitation in MEL cell nuclear extracts using the 6TA 2B11 antibody clone. IgG antibody was used as a control. GATA1 is detected in the IP fraction, confirming the MS results. Sup, supernatant. (C) TAF10 alone or a TAF8-TAF10 heterodimer was immunopurified using an anti-TAF10 antibody from SFf9 cell extracts and tested by Western blotting (WB) using the indicated antibodies. The GST-GATA1 protein or GST was also purified and tested by Coomassie brilliant blue (CBB) staining. (D) The purified proteins were combined as indicated above the gel and incubated, and after several washes the bead-bound proteins were denatured, resolved on an SDS-polyacrylamide gel, and analyzed by Western blotting using an anti-GST antibody. The antibody heavy chain (AbHc) and antibody light chain (AbLc) are indicated.
FIG 8
FIG 8
Immunoprecipitation of TAF10 and GATA1 in MEL cells and mouse fetal liver at E12.5. (A) MEL cells and mouse fetal liver nuclear cell extracts were used to immunoprecipitate GATA1 endogenous protein or bio-GATA1 overexpressed in MEL cells. GATA1 (N6) IP or streptavidin pulldown (pd) coimmunoprecipitates GATA1/bio-GATA1 and TAF10 protein, as detected by Western blotting assays using M20 (GATA1) and 6TA 2B11 (TAF10) antibodies. BirA MEL cells were used as controls. (B) TAF10 (6TA 2B11) IP in MEL cells in which bio-GATA1 is overexpressed coimmunoprecipitate GATA1 in the reverse IP. HRP, horseradish peroxidase.
FIG 9
FIG 9
ChIP assays of TAF10 and GATA1 in the GATA1 locus in hFL and hPB cells. A TAF10 antibody (monoclonal antibody 23TA 1H8) and a GATA1 antibody were used to immunoprecipitate the formaldehyde-cross-linked chromatin from hFL and hPB cells. (A) Primers for GATA1 binding sites of the human GATA1 locus, as indicated (the palindromic GATA1 binding site [BS] and GATA1 binding site at the kb −3 region relative to the TSS), were used to estimate the relative fold enrichment (RFE) of TAF10 and GATA1 binding by qRT-PCR. A CD71 antibody (isotype control) was used for the mock IP, and background enrichment was set equal to a value of 1. IE, exon I erythroid. (B) Enrichment for TAF10 and GATA1 at both binding sites of interest is shown in independent experiments for fetal liver and adult blood. (C) Overview of all ChIP experiments. See panel A for the positions of the primers.

References

    1. Muller F, Tora L. 2013. Chromatin and DNA sequences in defining promoters for transcription initiation. Biochim Biophys Acta 1893:118–126. doi:10.1016/j.bbagrm.2013.11.003. - DOI - PubMed
    1. Gershenzon NI, Ioshikhes IP. 2005. Synergy of human Pol II core promoter elements revealed by statistical sequence analysis. Bioinformatics 21:1295–1300. doi:10.1093/bioinformatics/bti172. - DOI - PubMed
    1. Zhang MQ. 1998. Identification of human gene core promoters in silico. Genome Res 8:319–326. doi:10.1101/gr.8.3.319. - DOI - PMC - PubMed
    1. Gangloff YG, Romier C, Thuault S, Werten S, Davidson I. 2001. The histone fold is a key structural motif of transcription factor TFIID. Trends Biochem Sci 26:250–257. doi:10.1016/S0968-0004(00)01741-2. - DOI - PubMed
    1. Kaufmann J, Smale ST. 1994. Direct recognition of initiator elements by a component of the transcription factor IID complex. Genes Dev 8:821–829. doi:10.1101/gad.8.7.821. - DOI - PubMed

Publication types

MeSH terms

Substances