. 2015 Apr 28;112(17):5509-14.
doi: 10.1073/pnas.1505909112. Epub 2015 Apr 13.

MeCP2 binds to non-CG methylated DNA as neurons mature, influencing transcription and the timing of onset for Rett syndrome

Affiliations

MeCP2 binds to non-CG methylated DNA as neurons mature, influencing transcription and the timing of onset for Rett syndrome

Lin Chen et al. Proc Natl Acad Sci U S A. .

Erratum in

Abstract

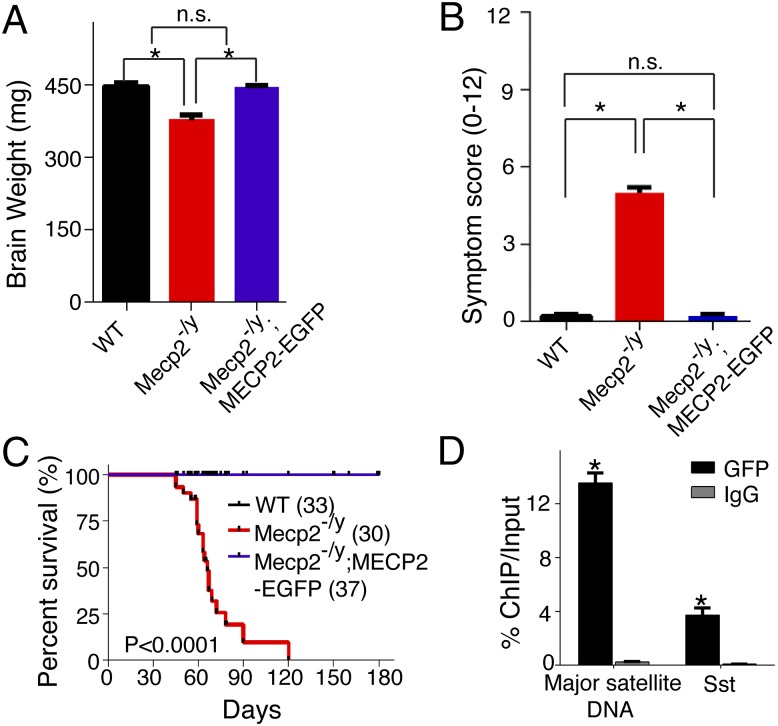
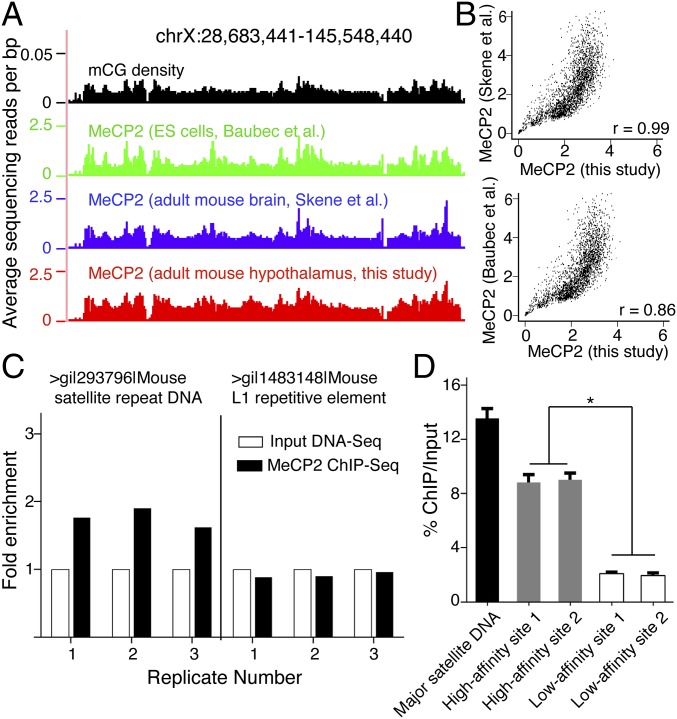
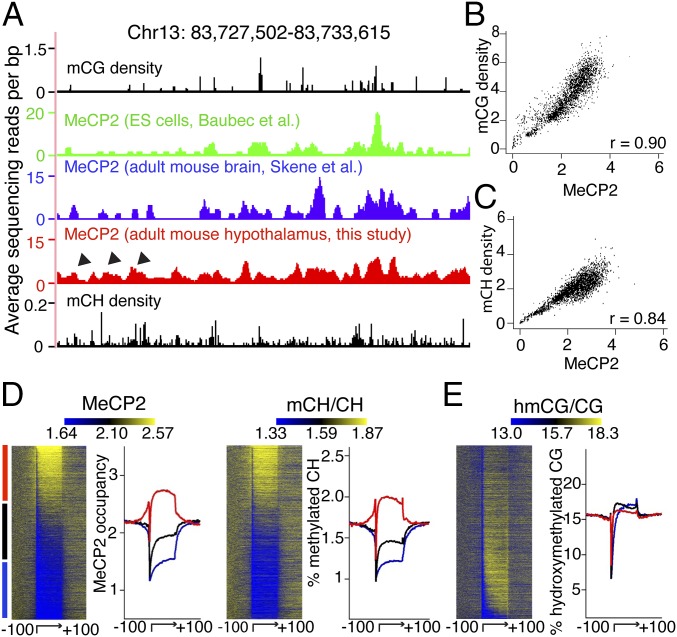
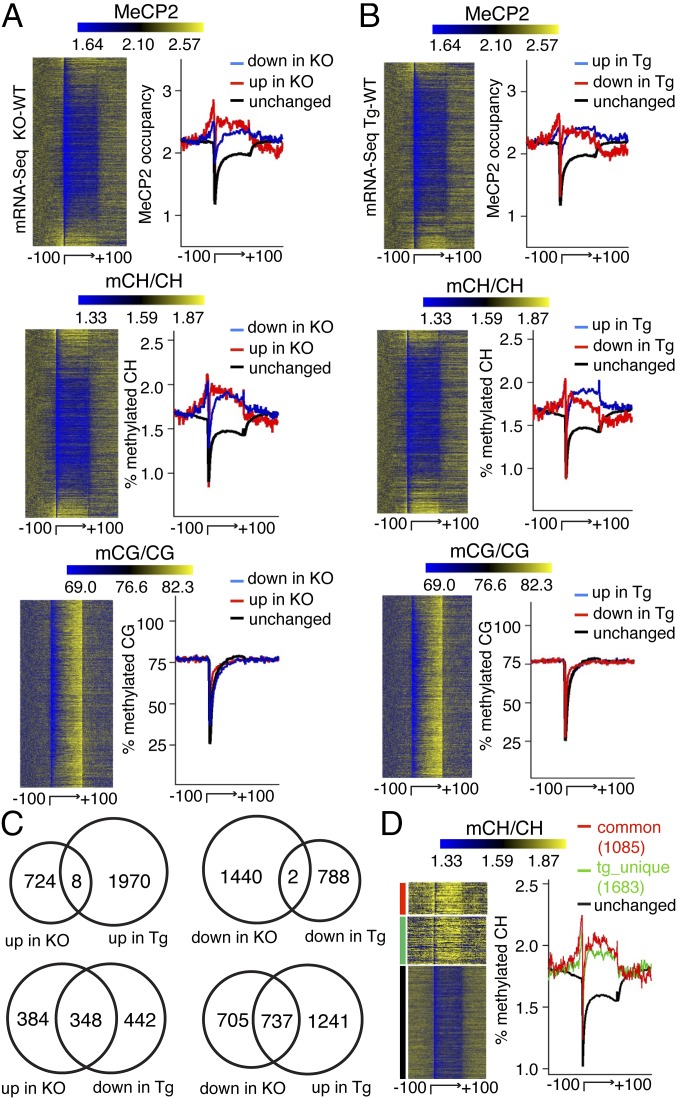
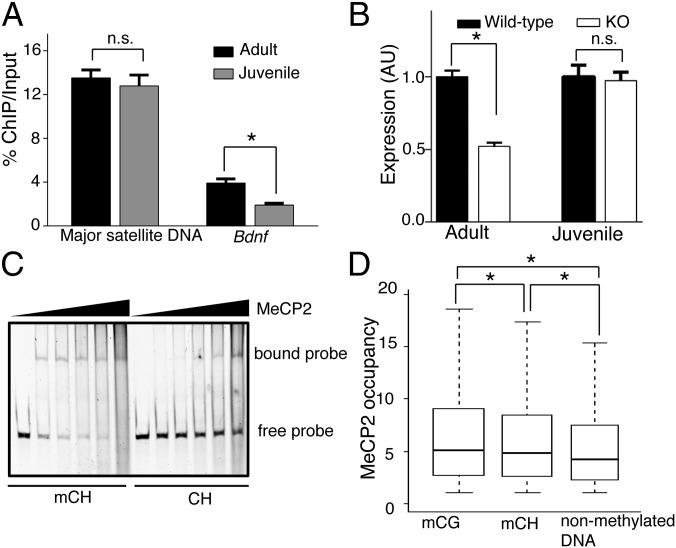
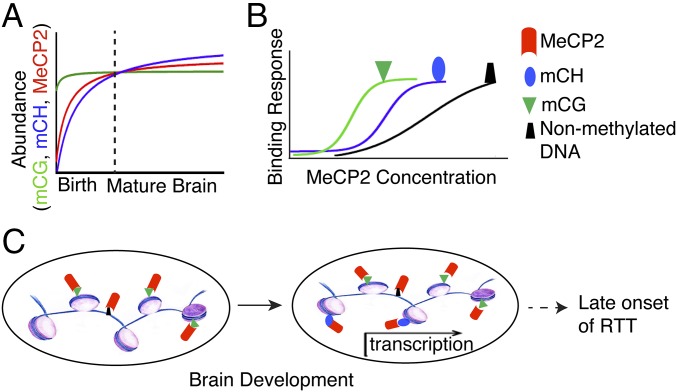
Epigenetic mechanisms, such as DNA methylation, regulate transcriptional programs to afford the genome flexibility in responding to developmental and environmental cues in health and disease. A prime example involving epigenetic dysfunction is the postnatal neurodevelopmental disorder Rett syndrome (RTT), which is caused by mutations in the gene encoding methyl-CpG binding protein 2 (MeCP2). Despite decades of research, it remains unclear how MeCP2 regulates transcription or why RTT features appear 6-18 months after birth. Here we report integrated analyses of genomic binding of MeCP2, gene-expression data, and patterns of DNA methylation. In addition to the expected high-affinity binding to methylated cytosine in the CG context (mCG), we find a distinct epigenetic pattern of substantial MeCP2 binding to methylated cytosine in the non-CG context (mCH, where H = A, C, or T) in the adult brain. Unexpectedly, we discovered that genes that acquire elevated mCH after birth become preferentially misregulated in mouse models of MeCP2 disorders, suggesting that MeCP2 binding at mCH loci is key for regulating neuronal gene expression in vivo. This pattern is unique to the maturing and adult nervous system, as it requires the increase in mCH after birth to guide differential MeCP2 binding among mCG, mCH, and nonmethylated DNA elements. Notably, MeCP2 binds mCH with higher affinity than nonmethylated identical DNA sequences to influence the level of Bdnf, a gene implicated in the pathophysiology of RTT. This study thus provides insight into the molecular mechanism governing MeCP2 targeting and sheds light on the delayed onset of RTT symptoms.

Keywords: MeCP2; Non-CpG methylation; Rett syndrome; mCH; transcriptional regulation.


Conflict of interest statement

The authors declare no conflict of interest.

Figures

Fig. 1.
Fig. 1.
Characterization of a functional MECP2-EGFP transgenic mouse line that allows for highly efficient and specific ChIP. (A and B) MeCP2-EGFP rescued brain weight and disease symptoms of Mecp2 knockout mouse. Each bar represents SEM; n = 20–25 per genotype; *P < 0.01; n.s., not significant by paired, one-tailed Student’s t test. Symptom scoring was performed as described previously (29, 30). (C) MeCP2-EGFP rescued early lethality of Mecp2 knockout mouse. P < 0.0001 by Log-rank test. (D) MeCP2-EGFP binds to previously characterized DNA elements (13). In ChIP-PCR experiments, anti-GFP antibody displayed high efficiency (∼13% ChIP/Input for mouse major satellite DNA) and specificity (more than 50-fold enrichment over ChIP using control IgG antibody for mouse major satellite DNA and a promoter region of Sst). Each bar represents SEM; n = 3–4; *P < 0.05 by paired, one-tailed Student’s t test when comparing ChIP with GFP and control IgG antibodies.
Fig. 2.
Fig. 2.
MeCP2 binds the entire genome with differential affinity in the adult mouse brain. (A) Browser representation of mCG density and normalized MeCP2 binding spanning example chromosomal region (Top, representing the x axis). Shown are mCG density in the adult mouse brain (black), previously reported MeCP2 binding in ES cells (green), adult mouse brain (blue), and results from the current study in the adult mouse hypothalamus (red). (B) Correlation between MeCP2 binding profiles from our high-resolution data and previous data from the adult mouse brain (Upper) and ES cells (Lower). Raw reads were binned per 1 Mb across the entire mouse genome. r denotes Pearson’s correlation. (C) Enrichment of repetitive DNA elements from three biological replicates, showing significant increase of mouse major satellite DNA, but not L1 repetitive element after MeCP2 ChIP-Seq relative to Input DNA-Seq. Data were normalized and represented as the fold-change relative to each Input DNA-Seq control. (D) RT-PCR analysis of isolated DNA from ChIP using primers for two representative high-affinity sites (gray) and two low-affinity sites (white) in the mouse genome. Mouse major satellite DNA (black) was used as a positive control for the high-affinity site. Each bar represents SEM; n = 3 or 4; *P < 0.05 by one-way ANOVA followed by Student’s t test.
Fig. 3.
Fig. 3.
mCH is a distinct determinant of MeCP2 binding in the adult mouse brain. (A) Browser representation of MeCP2 binding spanning an example chromosomal region (Top, representing the x axis). Shown are mCG density in adult mouse brain (black) and MeCP2 binding in ES cells (green), whole adult mouse brains (blue), and adult mouse hypothalamus (red). Arrowhead denotes additional MeCP2 binding sites in the whole brain and hypothalamus that lack mCG density but coincide with mCH density peaks in the adult mouse brain (black). (B and C) Whole-genome representation of MeCP2 binding as a function of mCG density and mCH density in the adult mouse brain. r denotes Spearman’s correlation. (D) Heatmap representation of MeCP2 binding and mCH levels in the gene body and the flanking 100 kb for all mouse genes in the adult mouse brain, ranked by MeCP2 occupancy in the gene body. The graph to the right of each heatmap shows normalized MeCP2 and mCH profiles divided into levels of MeCP2 occupancy: highest third (red), intermediate (black), and lowest third (blue). (E) Heatmap representation and hmCG profiles for all mouse genes in the adult mouse brain ranked by the same method and depicted in the same color scheme as in D. Signal values in heatmap and average plot are normalized so that the mean signal value in flanking regions of each gene will be the same in D and E.
Fig. 4.
Fig. 4.
MeCP2 binds mCH to influence transcription in the adult mouse brain. (A) Heatmap representation of MeCP2 binding, mCH and mCG in the gene body, and the flanking 100 kb for all mouse genes, ranked by mRNA expression changes in the adult MeCP2 knockout (KO) brain compared with wild-type (WT) and presented from top to bottom in ascending order (from most down-regulated to most up-regulated). Right panel of each heatmap shows quantitative profiles. Chart depicts up-regulated genes (red), down-regulated genes (blue), and unchanged genes (black) in MeCP2 KO brain. (B) Same as in A except that the data are ranked by mRNA expression changes in the adult MeCP2 transgenic (Tg) mouse brain compared with wild-type and presented from top to bottom in ascending order (from most down-regulated to most up-regulated). Chart depicts up-regulated genes (blue), down-regulated genes (red), and unchanged genes (black) in MeCP2 Tg adult mouse brain. (C) Transcriptional changes in MeCP2 KO and Tg adult mouse brain compared with their corresponding WT. (D) Heatmap representation of flank-normalized mCH in genes with inverse expression changes in both MeCP2 mutants (red); a subgroup of uniquely misregulated genes in MeCP2 Tg animals (green); and those genes that are unchanged (black). Right panel shows quantitative profiles. Signal values in heatmap and average plot are normalized so that the mean signal value in flanking regions of each gene will be the same in A, B, and D.
Fig. 5.
Fig. 5.
Molecular determinants of genomic targeting of MeCP2. (A) RT-PCR analysis of isolated DNA from MeCP2-ChIP in adult and juvenile mouse hypothalamus using primers for mouse major satellite DNA and Bdnf. Each bar represents SEM; n = 3 or 4; *P < 0.05; n.s., not significant by paired, one-tailed Student’s t test. (B) RT-PCR analysis of Bdnf transcript levels from adult and juvenile mouse hypothalamus. Data were normalized to Gapdh and represented as the fold-expression relative to its age-matched wild-type. Each bar represents SEM; n = 3; *P < 0.05; n.s., not significant by paired, one-tailed Student’s t test. (C) EMSA analysis for recombinant full-length MeCP2 binding to methylated and nonmethylated Bdnf nucleotide sequence in vitro, showing increased binding to methylated substrate. (D) Normalized MeCP2 binding to mCG, mCH, and nonmethylated DNA at the genomic level. Raw reads were binned per 10 base pairs across the entire mouse genome. *P < 10−300 by Kolmogorov–Smirnov test for each pair-wise comparison.
Fig. 6.
Fig. 6.
Proposed model of MeCP2 genomic targeting to influence transcription. (A) During postnatal brain development the levels of MeCP2 (red) and mCH (blue) increase as neurons mature, whereas mCG (green) remains relatively stable. When DNA methylation patterns are fully developed together with higher levels of MeCP2 in the adult brain, differential binding affinity of MeCP2 for mCG (green), mCH (blue) and nonmethylated DNA (black) becomes apparent as illustrated in B. (C) In this context, MeCP2 can now bind available mCH sites to influence transcription. Thus, changes to MeCP2 levels or function, which lead to disease related phenotypes, only become apparent after the brain has fully matured.

Comment in

References

    1. Amir RE, et al. Rett syndrome is caused by mutations in X-linked MECP2, encoding methyl-CpG-binding protein 2. Nat Genet. 1999;23(2):185–188. - PubMed
    1. Lyst MJ, Bird A. 2015. Rett syndrome: A complex disorder with simple roots. Nat Rev Genet, 10.1038/nrg3897.
    1. Guy J, Hendrich B, Holmes M, Martin JE, Bird A. A mouse Mecp2-null mutation causes neurological symptoms that mimic Rett syndrome. Nat Genet. 2001;27(3):322–326. - PubMed
    1. Collins AL, et al. Mild overexpression of MeCP2 causes a progressive neurological disorder in mice. Hum Mol Genet. 2004;13(21):2679–2689. - PubMed
    1. Chahrour M, et al. MeCP2, a key contributor to neurological disease, activates and represses transcription. Science. 2008;320(5880):1224–1229. - PMC - PubMed

Publication types

Associated data