. 2015 May 5;112(18):E2337-46.
doi: 10.1073/pnas.1504778112. Epub 2015 Apr 13.

Heightened potency of human pluripotent stem cell lines created by transient BMP4 exposure

Affiliations

Heightened potency of human pluripotent stem cell lines created by transient BMP4 exposure

Ying Yang et al. Proc Natl Acad Sci U S A. .

Abstract

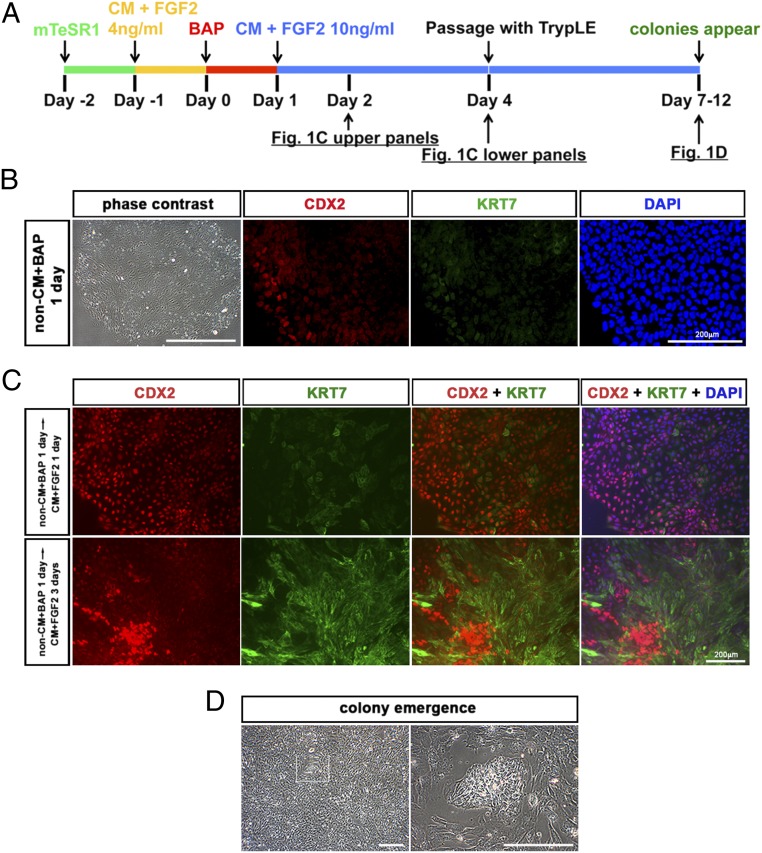
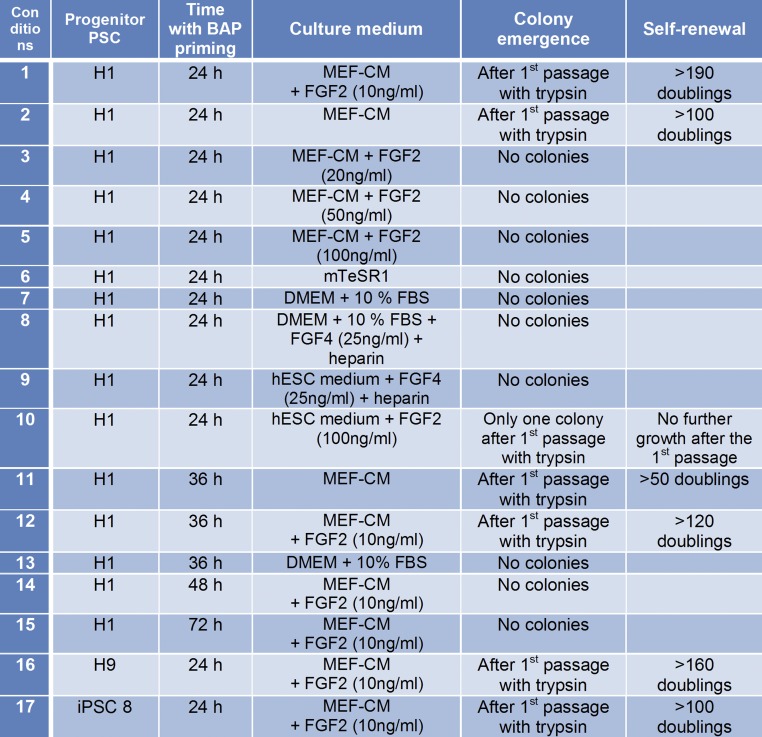
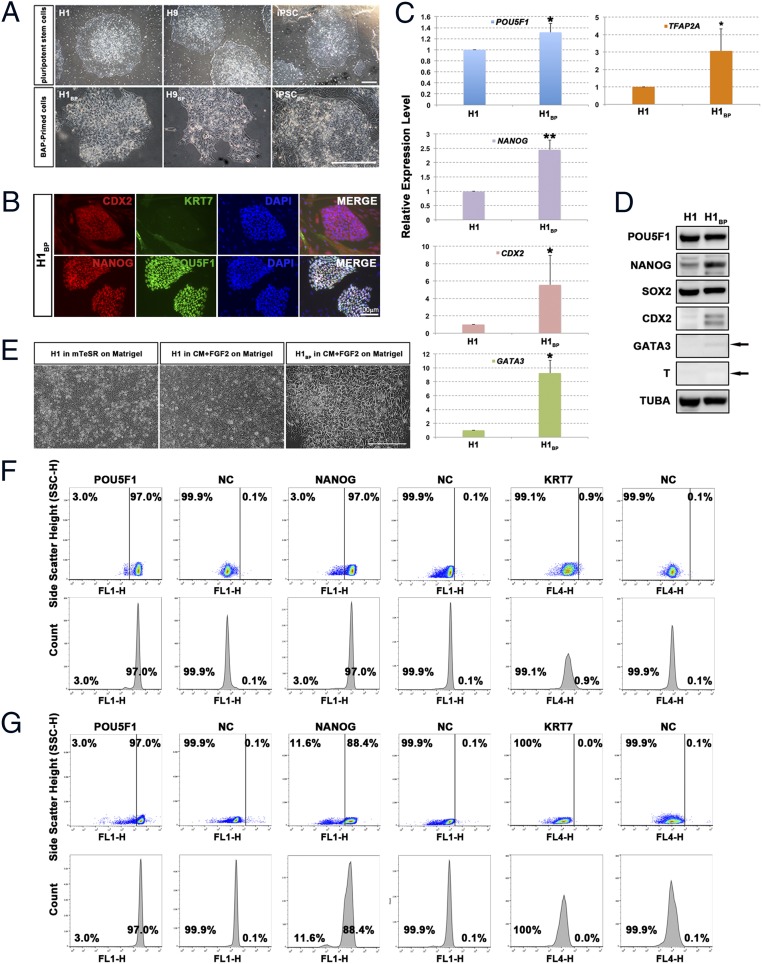
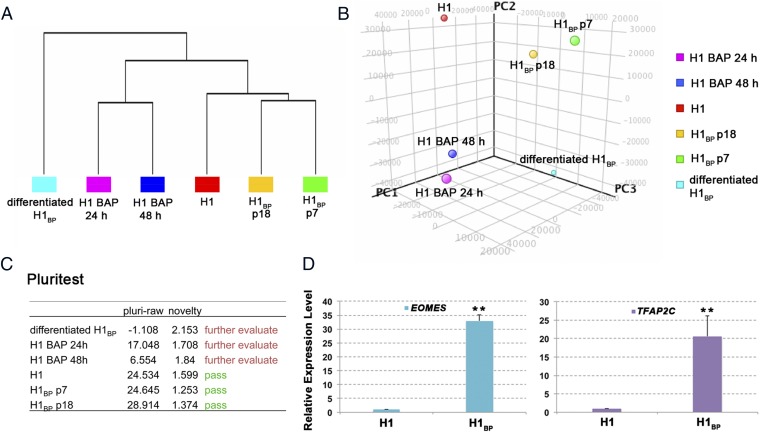
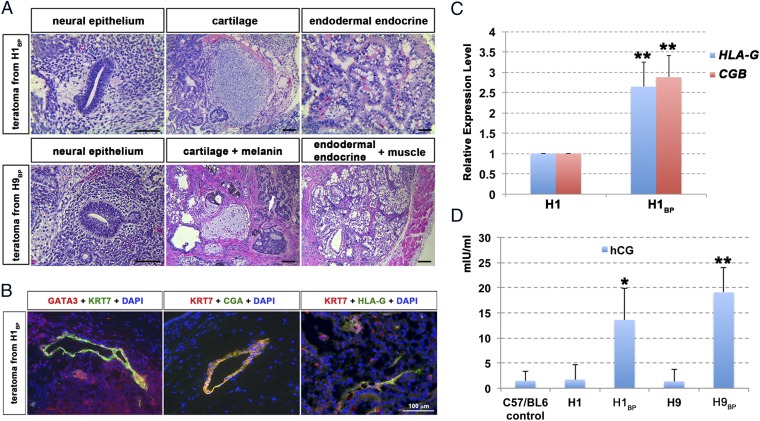
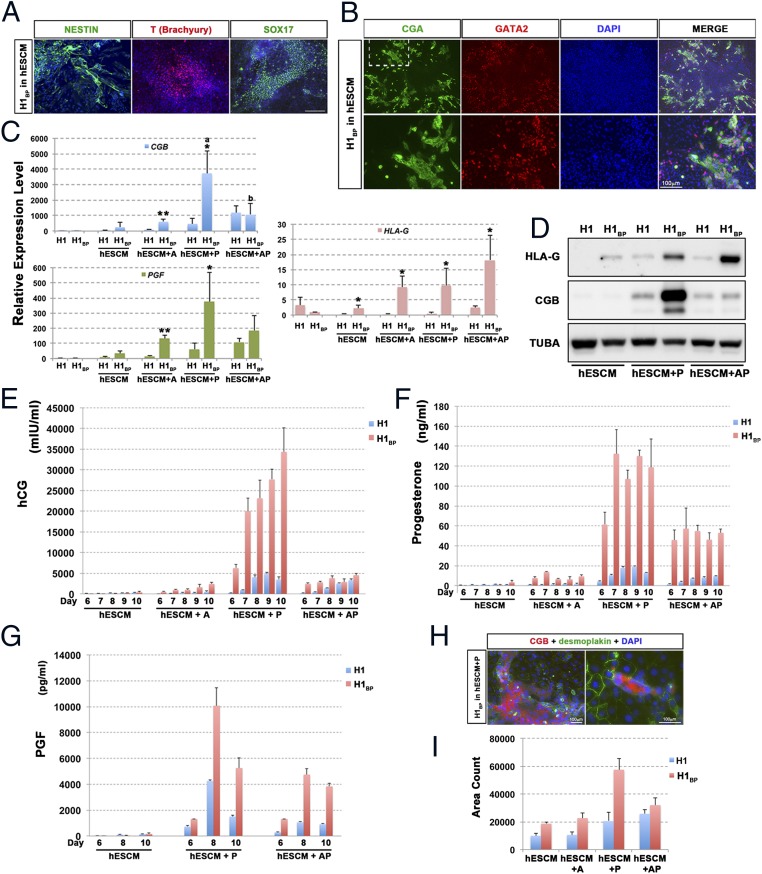
Human pluripotent stem cells (PSCs) show epiblast-type pluripotency that is maintained with ACTIVIN/FGF2 signaling. Here, we report the acquisition of a unique stem cell phenotype by both human ES cells (hESCs) and induced pluripotent stem cells (iPSCs) in response to transient (24-36 h) exposure to bone morphogenetic protein 4 (BMP4) plus inhibitors of ACTIVIN signaling (A83-01) and FGF2 (PD173074), followed by trypsin dissociation and recovery of colonies capable of growing on a gelatin substratum in standard medium for human PSCs at low but not high FGF2 concentrations. The self-renewing cell lines stain weakly for CDX2 and strongly for NANOG, can be propagated clonally on either Matrigel or gelatin, and are morphologically distinct from human PSC progenitors on either substratum but still meet standard in vitro criteria for pluripotency. They form well-differentiated teratomas in immune-compromised mice that secrete human chorionic gonadotropin (hCG) into the host mouse and include small areas of trophoblast-like cells. The cells have a distinct transcriptome profile from the human PSCs from which they were derived (including higher expression of NANOG, LEFTY1, and LEFTY2). In nonconditioned medium lacking FGF2, the colonies spontaneously differentiated along multiple lineages, including trophoblast. They responded to PD173074 in the absence of both FGF2 and BMP4 by conversion to trophoblast, and especially syncytiotrophoblast, whereas an A83-01/PD173074 combination favored increased expression of HLA-G, a marker of extravillous trophoblast. Together, these data suggest that the cell lines exhibit totipotent potential and that BMP4 can prime human PSCs to a self-renewing alternative state permissive for trophoblast development. The results may have implications for regulation of lineage decisions in the early embryo.

Keywords: biological sciences; developmental biology; pluripotent stem cells; totipotent; trophoblast.


Conflict of interest statement

The authors declare no conflict of interest.

Figures

Fig. 1.
Fig. 1.
Procedure for deriving PSCBP colonies. (A) Human ESC lines (H1 and H9) and a well-characterized human iPSC line were progressively cultured on mTeSR1 medium (green line) and conditioned medium containing FGF2 (4 ng/mL) (CM + FGF2) for 24 h (yellow line), and then treated with BAP (BMP4, 10 ng/mL; A83-01, 1 μM; PD173074, 0.1 μM; red line) for 24 h (25). To prevent further progression along the trophoblast lineage, the medium was changed to standard ESCM lacking BAP (blue line) and containing FGF2 (10 ng/mL). After a further 3 d (day 4), the colonies were dispersed to single cells with TrypLE and cultured on the same FGF2-containing medium on a gelatin substratum. (B) Images of H1 colonies treated with BAP for 24 h (red-line phase). Cells had an epithelium-like morphology in a phase-contrast image, and some, near the periphery of colonies, were CDX2+. KRT7 immunofluorescence was very faint. Nuclear stain with DAPI was captured at the same site. (C) Images of H1 colonies in standard ESCM with FGF2 after the transient BAP treatment (blue-line phase). (Upper) H1 colonies 24 h after removal of BAP (day 2) when most cells were CDX2+. Variable KRT7-expressing cells within the colonies were also detectable. (Lower) H1 colonies 3 d after removal of BAP (day 4). Cells in the colony were consistent with cells seemingly organized into patches of strongly CDX2+ but KRT7 cells and cells with down-regulated CDX2 and highly up-regulated KRT7. (D) Colonies emerged among a background of scattered surrounding cells between days 3 and 8 after passage with TrypLE (days 7–12). (Scale bars: phase-contrast images, 500 μm; immunofluorescence images, 200 μm.)
Fig. 2.
Fig. 2.
Summary of conditions used to derive and maintain of PSCBP. Trypsin is TrypLE (recombinant trypsin).
Fig. 3.
Fig. 3.
Characterization of PSCBP colonies. (A) Typical colony morphologies of H1 cells, H9 cells, and iPSCs (Upper) and of H1BP cells, H9BP cells, and iPSCBP (Lower). (Scale bar: 500 μm.) (B) H1BP colonies immunostained for CDX2, KRT7, NANOG, and POU5F1. (Scale bar: 100 μm.) (C) Real-time PCR assessments (n = 3; i.e., three RNA preparations from three independent experiments) of relative concentrations of transcripts for POU5F1, NANOG, CDX2, GATA3, and TFAP2A in H1BP cells relative to H1 cells (with GAPDH as an endogenous standard). To provide comparisons, the mean concentration of each transcript in H1 cells has been assigned a value of 1 (*P < 0.05; **P < 0.01; mean ± SD). (D) Western blotting of SDS gels used for analysis of proteins present in 30 μg of H1 and H1BP cell extracts. The arrow indicates the anticipated mobility of GATA3 and T (Brachyury) based on their migration rate (Mr). All analyses were performed on the same 10% polyacrylamide gel. TUBA, α-tubulin. (E) Morphology of H1 cells cultured on Matrigel in mTeSR1 medium or CM supplemented with 10 ng/mL FGF2 and H1BP cells cultured on Matrigel in CM supplemented with 10 ng/mL FGF2. (Scale bar: 100 μm.) Flow cytometry histograms for POU5F1, NANOG, and KRT7 expression in H1BP (F) and H1 (G) cells are shown. For the negative control (NC), cells were exposed to IgG and a second antibody without prior exposure to primary antibodies.
Fig. 4.
Fig. 4.
Comparison of the transcriptomes of H1 colonies and H1BP colonies at two different passage numbers (p7 and p18) in H1 colonies that were exposed to BAP conditions for 24 and 48 h and H1BP colonies that had been allowed to differentiate spontaneously [10 d on defined hESCM medium (i.e., nonconditioned ESC medium minus FGF2 and BMP4, differentiated H1BP cells). Unsupervised hierarchical clustering (A) and principal component analysis of microarray data (B), outcomes of analysis by the PluriTest (www.pluritest.org) based on overall gene expression (C), and confirmation of the >twofold up-regulation of two genes (EOMES and TFAP2C) in H1BP vs. H1 cells by real-time PCR (D). Conditions were as in Fig. 3C (**P < 0.01). PC, principal component.
Fig. 5.
Fig. 5.
In vivo differentiation of PSCBP. (A) Histological analysis of teratomas generated from H1BP (Upper) and H9BP (Lower) cells after injecting 107 cells into the dorsal flanks of nonobese diabetic SCID-γ mice for 6.0 and 6.9 wk, respectively. The tissue sections were stained by H&E and indicate the presence of representative ectoderm-derived [Left, neural epithelium; Lower Center, melanin-producing cells (white arrow)], endoderm-derived (Right, gut-like epithelium accompanied with secretory glands), and mesoderm-derived (Center, cartilage tissues; Lower Right, muscle) tissues. (Scale bar: 100 μm.) (B) Immunohistological images show areas of presumptive trophoblast staining for GATA3+ and KRT7+, CGA+ and KRT7+, and HLA-G+ and KRT7+ cells from H1BP teratomas. (Scale bar: 100 μm.) (C) Real-time PCR assessments (n = 3; i.e., three PCR reactions from the same RNA preparation from each teratoma) of relative concentrations of transcripts for HLA-G and CGB in an H1BP teratoma relative to an H1 teratoma (with GAPDH as an endogenous standard). To provide comparisons, the mean concentration of each transcript in H1 cells has been assigned a value of 1 (**P < 0.01; mean ± SD). (D) Comparisons of hCG concentrations (mIU/mL) in sera of control mice (first column) and mice bearing teratomas from H1, H1BP, H9, and H9BP cells (second–fifth columns). Values (mean ± SD) for mice carrying teratomas from H1BP and H9BP cells are significantly higher than in controls (*P < 0.05; **P < 0.01), where hCG concentrations for control mice and mice with H1 and H9 teratomas were close to the detection limit of the ELISA.
Fig. 6.
Fig. 6.
In vitro differentiation of H1BP cells. (A) Differentiation of H1BP cells to colonies containing presumptive ectoderm (NESTIN), mesoderm (T, Brachyury), and endoderm (SOX17) by culturing in basal, chemically-defined hESCM without any growth factors for 10 d. (Scale bar: 100 μm.) (B) Some colonies cultured as in A also contained areas of presumptive trophoblast, which were positive for both CGA (green) and GATA2 (red). (C) Comparison of relative expressions of CGB, PGF, and HLA-G in H1 and H1BP colonies that had been cultured under five different culture conditions [1, controls in MEF feeder cell-conditioned medium plus FGF2; 2, hESCM with no additions (hESCM); 3, hESCM plus A83-01 (hESCM + A); 4, hESCM plus PD173074 (hESCM + P); 5, hESCM plus A83-01 and PD173074 (hESCM + AP)] for 10 d. The values are the mean ± SD for three separate experiments. Comparisons between H1 and H1BP cells under each culture condition were evaluated by the Student’s t test (*P < 0.05; **P < 0.01). Values across treatments were assessed by ANOVA (different letters indicate values differed from each other by at least P < 0.05). (D) Representative Western blot comparing relative concentrations of HLA-G and CGB in H1 and H1BP cells cultured in either hESCM with no additions or in the same medium supplemented with A, P, or A plus P. The data were all from the same blot of a 10% SDS-polyacrylamide blot (30 μg of protein per lane). The loading control is TUBA. Comparison between H1 (blue bars) and H1BP (red bars) cells in production of three placental hormones [hCG (E), progesterone (F), and PGF (G)] over time of culture in four different media (hESCM, hESCM + A, hESCM + P, and hESCM + AP as defined above) for up to 10 d. The values are the mean ± SD for three separate experiments. The medium was replaced daily, such that values represent daily production and release of the hormones to the medium. Analyses of PGF were limited to days 6, 8, and 10 and to just three of the media for cost considerations. The values for hCG production are also illustrated in Table S6 to demonstrate that measurable amounts of hormone were secreted in the hESCM by both cell types. (H) In the presence of PD173074 (hESCM + P), large areas of syncytiotrophoblasts were detected by double staining for DSP (green) and CGB (red), indicating that the syncytial areas had a continuous cytoplasm and contained multiple nuclei. (I) Quantification of syncytial areas (immunostaining for CGB+) from H1 and H1BP cells in four different media (hESCM, hESCM + A, hESCM + P, and hESCM + AP as defined above) for 10 d. CGB+ areas from nine frames of each experiment were automatically counted by imageJ software (NIH) and averaged.

Similar articles

Cited by

References

    1. Nichols J, Smith A. Naive and primed pluripotent states. Cell Stem Cell. 2009;4(6):487–492. - PubMed
    1. Brons IG, et al. Derivation of pluripotent epiblast stem cells from mammalian embryos. Nature. 2007;448(7150):191–195. - PubMed
    1. Tesar PJ, et al. New cell lines from mouse epiblast share defining features with human embryonic stem cells. Nature. 2007;448(7150):196–199. - PubMed
    1. Greber B, et al. Conserved and divergent roles of FGF signaling in mouse epiblast stem cells and human embryonic stem cells. Cell Stem Cell. 2010;6(3):215–226. - PubMed
    1. Vallier L, et al. Early cell fate decisions of human embryonic stem cells and mouse epiblast stem cells are controlled by the same signalling pathways. PLoS ONE. 2009;4(6):e6082. - PMC - PubMed

Publication types

MeSH terms

Associated data