

Electrocardiographic methods for diagnosis and risk stratification in the Brugada syndrome
- PMID: 25870503
- PMCID: PMC4392351
- DOI: 10.1016/j.jsha.2014.06.004
Electrocardiographic methods for diagnosis and risk stratification in the Brugada syndrome
Abstract
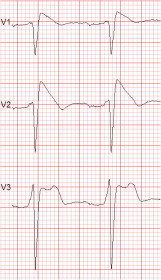
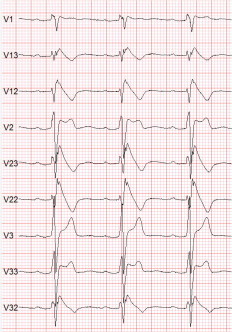
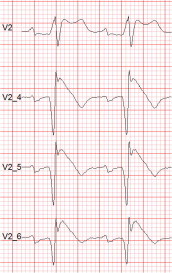
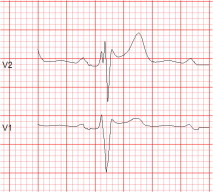
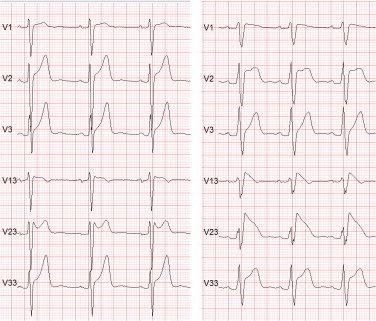
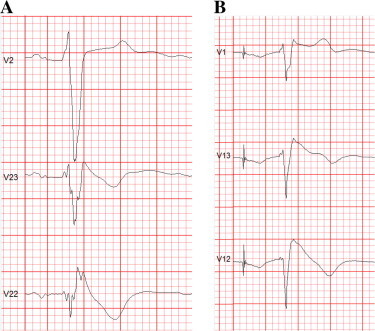
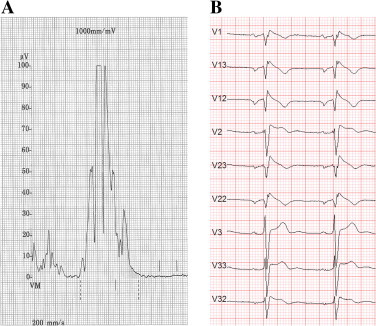
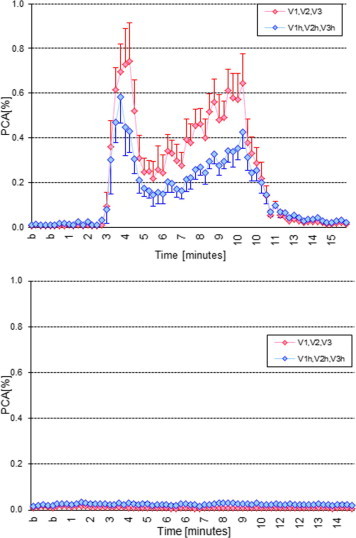
The Brugada syndrome (BrS) is a malignant, genetically-determined, arrhythmic syndrome manifesting as syncope or sudden cardiac death (SCD) in individuals with structurally normal hearts. The diagnosis of the BrS is mainly based on the presence of a spontaneous or Na + channel blocker induced characteristic, electrocardiographic (ECG) pattern (type 1 or coved Brugada ECG pattern) typically seen in leads V1 and V2 recorded from the 4th to 2nd intercostal (i.c.) spaces. This pattern needs to be distinguished from similar ECG changes due to other causes (Brugada ECG phenocopies). This review focuses mainly on the ECG-based methods for diagnosis and arrhythmia risk assessment in the BrS. Presently, the main unresolved clinical problem is the identification of those patients at high risk of SCD who need implantable cardioverter-defibrillator (ICD), which is the only therapy with proven efficacy. Current guidelines recommend ICD implantation only in patients with spontaneous type 1 ECG pattern, and either history of aborted cardiac arrest or documented sustained VT (class I), or syncope of arrhythmic origin (class IIa) because they are at high risk of recurrent arrhythmic events (up to 10% or more annually for those with aborted cardiac arrest). The majority of BrS patients are asymptomatic when diagnosed and considered to have low risk (around 0.5% annually) and therefore not indicated for ICD. The majority of SCD victims in the BrS, however, had no symptoms prior to the fatal event and therefore were not protected with an ICD. While some ECG markers such as QRS fragmentation, infero-lateral early repolarisation, and abnormal late potentials on signal-averaged ECG are known to be linked to increased arrhythmic risk, they are not sufficiently sensitive or specific. Potential novel ECG-based strategies for risk stratification are discussed based on computerised methods for depolarisation and repolarisation analysis, a composite approach targeting several major components of ventricular arrhythmogenesis, and the collection of large digital ECG databases in genotyped BrS patients and their relatives.
Keywords: AP, action potential; ARI, activation-recovery intervals; BrS, Brugada syndrome; Brugada syndrome; ECG, electrocardiogram; EPS, electrophysiology study; Electrocardiogram; Genetic arrhythmic syndromes; ICD, implantable cardioverter-defibrillator; IHD, ischaemic heart disease; LBBB, left bundle branch block; MAP, monophasic action potential; MI, myocardial infarction; PCA, principal component analysis; RVOT, right ventricular outflow tract; Risk stratification; SAECG, signal-averaged electrocardiogram; SCD, sudden cardiac death; SNP, single-nucleotide polymorphism; Sudden cardiac death; VF, ventricular fibrillation; VT, ventricular tachycardia; WT, wavelet transform.
Figures
Similar articles
-
The Brugada Syndrome - Diagnosis, Clinical Implications and Risk Stratification.Eur Cardiol. 2014 Dec;9(2):82-87. doi: 10.15420/ecr.2014.9.2.82. Eur Cardiol. 2014. PMID: 30310491 Free PMC article. Review.
-
[Doubts of the cardiologist regarding an electrocardiogram presenting QRS V1-V2 complexes with positive terminal wave and ST segment elevation. Consensus Conference promoted by the Italian Cardiology Society].G Ital Cardiol (Rome). 2010 Nov;11(11 Suppl 2):3S-22S. G Ital Cardiol (Rome). 2010. PMID: 21361048 Italian.
-
Brugada Syndrome as a Major Cause of Sudden Cardiac Death in Asians.JACC Asia. 2022 Jul 19;2(4):412-421. doi: 10.1016/j.jacasi.2022.03.011. eCollection 2022 Aug. JACC Asia. 2022. PMID: 36339362 Free PMC article. Review.
-
First-degree atrioventricular block on basal electrocardiogram predicts future arrhythmic events in patients with Brugada syndrome: a long-term follow-up study from the Veneto region of Northeastern Italy.Europace. 2019 Feb 1;21(2):322-331. doi: 10.1093/europace/euy144. Europace. 2019. PMID: 29986018
-
Beyond the type 1 pattern: comprehensive risk stratification in Brugada syndrome.J Interv Card Electrophysiol. 2025 Aug 6. doi: 10.1007/s10840-025-02101-z. Online ahead of print. J Interv Card Electrophysiol. 2025. PMID: 40767905 Review.
Cited by
-
Monogenec Arrhythmic Syndromes: From Molecular and Genetic Aspects to Bedside.Acta Naturae. 2016 Apr-Jun;8(2):62-74. Acta Naturae. 2016. PMID: 27437140 Free PMC article.
-
[Acute chest pain revealing a Brugada syndrome].Pan Afr Med J. 2016 Oct 18;25:95. doi: 10.11604/pamj.2016.25.95.9442. eCollection 2016. Pan Afr Med J. 2016. PMID: 28292058 Free PMC article. French.
-
Beyond motor neurons: expanding the clinical spectrum in Kennedy's disease.J Neurol Neurosurg Psychiatry. 2018 Aug;89(8):808-812. doi: 10.1136/jnnp-2017-316961. Epub 2018 Jan 20. J Neurol Neurosurg Psychiatry. 2018. PMID: 29353237 Free PMC article. Review.
-
Cardiac events occurred commonly among apparently healthy Filipinos with the Brugada ECG pattern in the LIFECARE cohort.Heart Asia. 2018 May 17;10(2):e010969. doi: 10.1136/heartasia-2017-010969. eCollection 2018. Heart Asia. 2018. PMID: 29868128 Free PMC article.
References
-
- Brugada P., Brugada J. Right bundle branch block, persistent ST segment elevation and sudden cardiac death: a distinct clinical and electrocardiographic syndrome. A multicenter report. J Am Coll Cardiol. 1992;20(6):1391–1396. - PubMed
-
- Antzelevitch C., Brugada P., Borggrefe M., Brugada J., Brugada R., Corrado D. Brugada syndrome: report of the second consensus conference: endorsed by the Heart Rhythm Society and the European Heart Rhythm Association. Circulation. 2005;111(5):659–670. - PubMed
-
- Kamakura S. Epidemiology of Brugada syndrome in Japan and rest of the world. J Arrhythm. 2013;29(2):52–55.
-
- Juang J.M., Huang S.K. Brugada syndrome—an under-recognized electrical disease in patients with sudden cardiac death. Cardiology. 2004;101(4):157–169. - PubMed
-
- Bozkurt A., Yas D., Seydaoglu G., Acartürk E. Frequency of Brugada-type ECG pattern (Brugada sign) in Southern Turkey. Int Heart J. 2006;47(4):541–547. - PubMed
Publication types
LinkOut - more resources
Full Text Sources
Other Literature Sources
