. 2015 Apr 20;6(11):9327-40.
doi: 10.18632/oncotarget.3313.

Co-inhibition of polo-like kinase 1 and Aurora kinases promotes mitotic catastrophe

Affiliations

Co-inhibition of polo-like kinase 1 and Aurora kinases promotes mitotic catastrophe

Jingjing Li et al. Oncotarget. .

Abstract

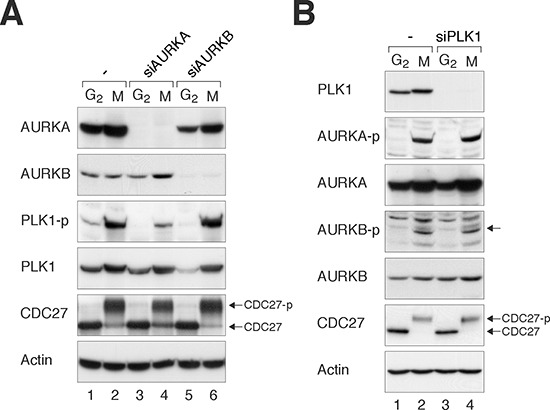
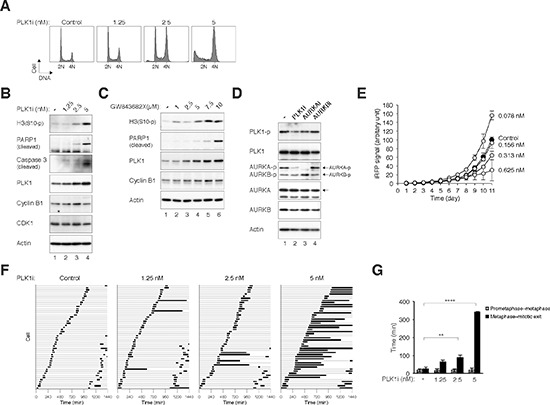
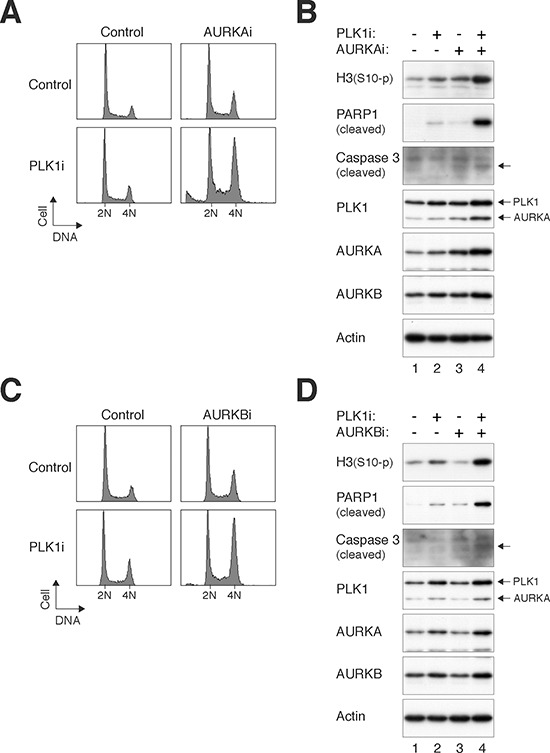
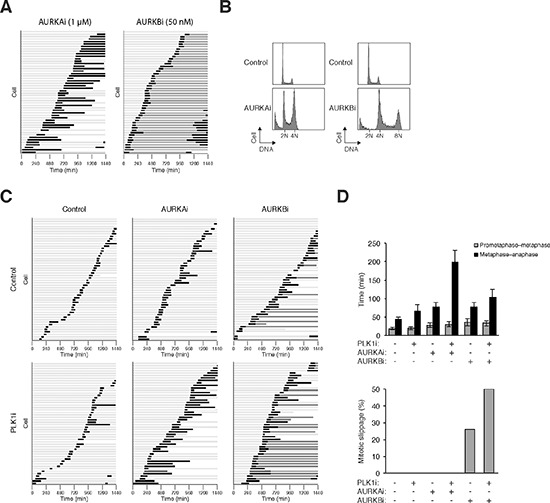
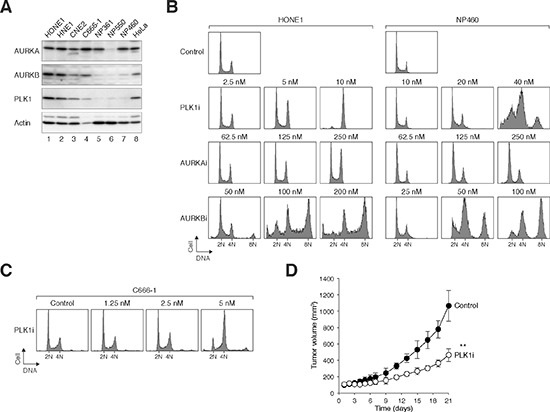
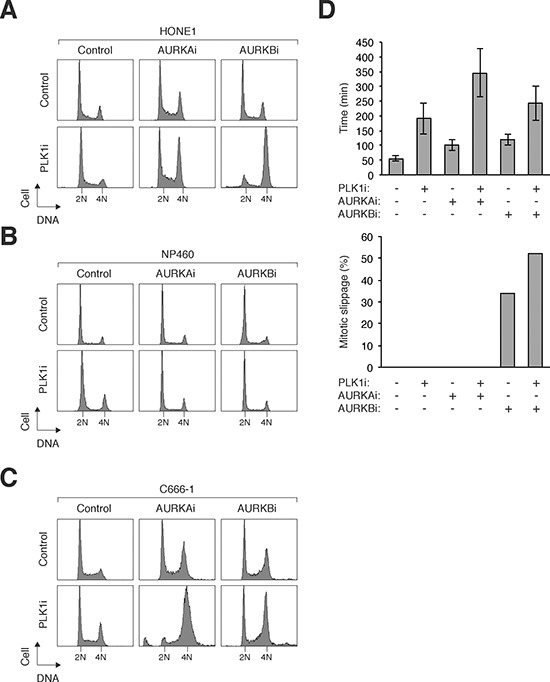
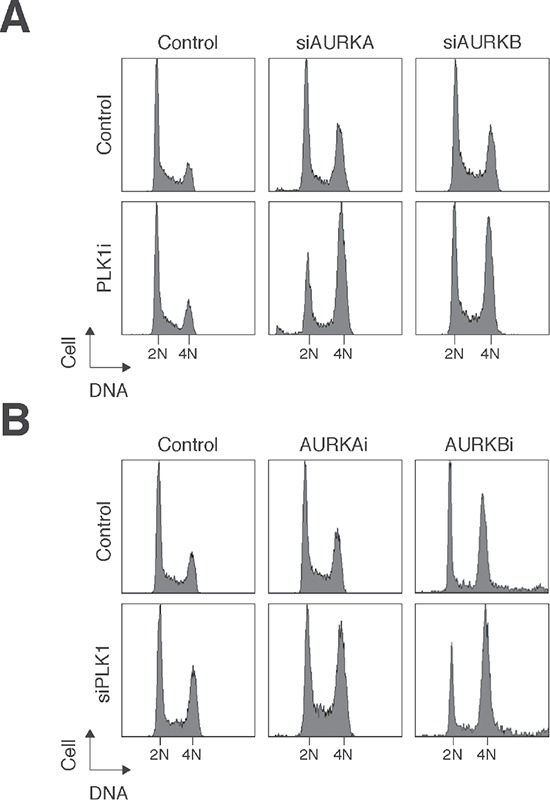
Mitosis is choreographed by a number of protein kinases including polo-like kinases and Aurora kinases. As these kinases are frequently dysregulated in cancers, small-molecule inhibitors have been developed for targeted anticancer therapies. Given that PLK1 and Aurora kinases possess both unique functions as well as co-regulate multiple mitotic events, whether pharmacological inhibition of these kinases together can enhance mitotic catastrophe remains an outstanding issue to be determined. Using concentrations of inhibitors that did not induce severe mitotic defects on their own, we found that both the metaphase arrest and mitotic slippage induced by inhibitors targeting Aurora A and Aurora B (MK-5108 and Barasertib respectively) were enhanced by a PLK1 inhibitor (BI 2536). We found that PLK1 is overexpressed in cells from nasopharyngeal carcinoma, a highly invasive cancer with poor prognosis, in comparison to normal nasopharyngeal epithelial cells. Nasopharyngeal carcinoma cells were more sensitive to BI 2536 as a single agent and co-inhibition with Aurora kinases than normal cells. These observations underscore the mechanism and potential benefits of targeting PLK1 and Aurora kinases to induce mitotic catastrophe in cancer cells.

Keywords: anticancer drugs; antimitotic drugs; kinases; mitosis; mitotic slippage.


Conflict of interest statement

CONFLICTS OF INTEREST

The authors declare no conflict of interest.

Figures

Figure 1
Figure 1. Loss of Aurora kinases disrupts PLK1 activity during mitosis
(A) Depletion of AURKA impairs the activation of PLK1. HeLa cells were transfected with control siRNA, siAURKA, or siAURKB. The cells were enriched in G2 phase or mitosis as described in Materials and Methods. Lysates were prepared and the indicated proteins were detected with immunoblotting. CDC27 analysis was included as a marker of mitosis. The positions of the unphosphorylated and mitotic form of CDC27 are indicated. Uniform loading of lysates was confirmed by immunoblotting for actin. (B) Depletion of PLK1 does not affect the activation of AURKA or AURKB. HeLa cells were transfected with control siRNA or siPLK1, before enriched in G2 phase or mitosis as described in Materials and Methods. Lysates were prepared and the indicated proteins were detected with immunoblotting.
Figure 2
Figure 2. Inhibition of PLK1 with BI 2536 induces metaphase defects and mitotic catastrophe
(A) Inhibition of PLK1 promotes G2/M delay and apoptosis in a dose-dependent manner. HeLa cells were incubated with buffer or the indicated concentrations of BI 2536 (PLK1i). After 24 h, the cells were harvested and the DNA content was analyzed with flow cytometry. The positions of 2N and 4N DNA content are indicated. (B) Inhibition of PLK1 induces mitotic catastrophe. HeLa cells were incubated with buffer or the indicated concentrations of PLK1i for 24 h. Lysates were prepared and the indicated proteins were detected with immunoblotting. Actin analysis was included to assess protein loading and transfer. (C) Treatment with the PLK1 inhibitor GW843682X induces mitotic catastrophe. HeLa cells were incubated with buffer or the indicated concentrations of GW843682X for 24 h. Lysates were prepared and the indicated proteins were detected with immunoblotting. (D) Inhibition of PLK1 affects AURKA activity. Mitotic HeLa cells were isolated by treating cells with nocodazole for 16 h followed by mechanical shake off. The cells were either untreated or incubated with PLK1i, AURKAi, or AURKBi. The proteasome inhibitor MG132 was added to prevent the cells from exiting mitosis. The cells were harvested after 2 h. Lysates were prepared and the indicated proteins were detected with immunoblotting. (E) Low concentrations of PLK1i stimulate cell proliferation. HeLa cells expressing iRFP (~200 cells) were seeded onto 6-well culture plates and cultured in the presence of buffer or different concentrations of PLK1i. On different days, the plate was scanned with an Odyssey infrared imaging system and the iRFP signal was quantified (average± SD of three independent experiments). Note that the PLK1i was left in the medium continuously throughout the experiment. At 0.078 nM, PLK1i significantly increased cell proliferation (P < 0.001; Student's t-test). (F) Inhibition of PLK1 induces a delay in mitosis. HeLa cells expressing histone H2B-GFP were exposed to buffer or the indicated concentrations of PLK1i. Individual cells were then tracked for 24 h with time-lapse microscopy. Each horizontal bar represents one cell (n = 50). Light grey: interphase; black: mitosis (from DNA condensation to anaphase or mitotic slippage); truncated bars: cell death. (G) PLK1i inhibits metaphase–anaphase transition. Cells were treated and imaged as described in panel (F). The duration from prometaphase to metaphase and from metaphase to the end of mitosis (anaphase, apoptosis, or the end of imaging period) was quantified (average ±90% CI). PLK1i treatment significantly extended mitosis after the metaphase was formed (****: P < 0.0001; **: P < 0.01; Student's t-test).
Figure 3
Figure 3. PLK1i cooperates with Aurora kinase inhibitors to induce mitotic catastrophe
(A) PLK1i cooperates with AURKAi to induce G2/M delay. HeLa cells were incubated with PLK1i (2.5 nM) and/or AURKAi (250 nM) as indicated. After 24 h, the cells were harvested and analyzed with flow cytometry. The positions of 2N and 4N DNA content are indicated. (B) Mitotic catastrophe induced by PLK1i and AURKAi. Cells were treated as described in panel (A). Lysates were prepared and the indicated proteins were detected with immunoblotting. Note that the PLK1 blot was performed after probing the membrane with AURKA antibodies. Equal loading of lysates was confirmed by immunoblotting for actin. (C) PLK1i cooperates with AURKBi to induce G2/M delay. HeLa cells were incubated with PLK1i (2.5 nM) and/or AURKBi (12.5 nM) as indicated. After 24 h, the cells were harvested and analyzed with flow cytometry. (D) Mitotic catastrophe induced by PLK1i and AURKBi. Cells were treated as described in panel (C). Lysates were prepared and the indicated proteins were detected with immunoblotting. Note that the PLK1 blot was performed after probing the membrane with AURKA antibodies (the positions of PLK1 and AURKA are indicated). Equal loading of lysates was confirmed by immunoblotting for actin.
Figure 4
Figure 4. PLK1i cooperates with Aurora kinase inhibitors to induce mitotic arrest and slippage
(A) Inhibition of AURKA and AURKB triggered mitotic arrest and mitotic slippage respectively. HeLa cells expressing histone H2B-GFP were incubated with AURKAi (1 μM) or AURKBi (50 nM). Individual cells were then tracked for 24 h with time-lapse microscopy. Each horizontal bar represents one cell (n = 50). Light grey: interphase; black: mitosis (from DNA condensation to anaphase or mitotic slippage); dark grey: mitotic slippage; truncated bars: cell death. (B) Cells were treated with AURKAi or AURKBi as described in panel (A). After 24 h, the cells were harvested and analyzed with flow cytometry. The positions of 2N, 4N, and 8N DNA content are indicated. (C) PLK1i cooperates with Aurora kinase inhibitors to induce mitotic arrest and slippage. HeLa cells expressing histone H2B-GFP were incubated with PLK1i (2.5 nM), AURKAi (250 nM), and AURKBi (12.5 nM). Individual cells were then tracked for 24 h with time-lapse microscopy. Each horizontal bar represents one cell (n = 50). Light grey: interphase; black: mitosis (from DNA condensation to anaphase or mitotic slippage); dark grey: mitotic slippage; truncated bars: cell death. (D) Cells were treated and imaged as described in panel (C). The duration of mitosis (from prometaphase–metaphase and from metaphase–anaphase was quantified (average ±90% CI; n = 50). The percentage of cells that underwent mitotic slippage was also quantified (lower panel).
Figure 5
Figure 5. NPC cells are more sensitive to PLK1i than normal NP epithelial cells
(A) PLK1 and AURKB are overexpressed in nasopharyngeal carcinoma (NPC) cell lines. Several NPC (HONE1, HNE1, CNE2, and C666-1) and immortalized normal nasopharyngeal (NP) cell lines (NP361, NP550, and NP460) were analyzed. Lysates from HeLa cells were also loaded for comparison. Cell-free extracts were prepared and the indicated proteins were detected by immunoblotting. (B) HONE1 cells are more sensitive than normal NP cells to PLK1i. HONE1 and normal NP NP460 cells were incubated with various concentrations of PLK1i, AURKAi, or AURKBi. After 24 h (for HONE1) or 48 h (for NP460), the cells were harvested and analyzed with flow cytometry. Control cells are shown on the top. Note that different concentrations of the drugs were used for the two cell lines to illustrate that HONE1 was more sensitive to PLK1i than NP460. (C) C666-1 cells are sensitive to PLK1 inhibition. C666-1 cells were incubated with the indicated concentrations of PLK1i. After 48 h, the cells were harvested and analyzed with flow cytometry. (D) PLK1i inhibits tumor growth in mouse xenograft models. HONE1 cells were injected subcutaneously into nude mice. PLK1i was delivered at the indicated time points as described in Materials and Methods. The volume of the tumor was measured on different days (control, black circle, n = 6; PLK1i, white circle, n = 6) (mean±SD). Treatment with PLK1i significantly reduced tumor growth (**: P < 0.01; paired t-test).
Figure 6
Figure 6. Co-inhibition of PLK1 and Aurora kinases specifically sensitizes NPC cells
(A) Co-inhibition of PLK1 and Aurora kinases induces mitotic defects in NPC cells. HONE1 cells were incubated with a combination of PLK1i (2.5 nM), AURKAi (250 nM), and AURKBi (25 nM). After 24 h, the cells were harvested and analyzed with flow cytometry. (B) NP460 cells are not affected by combinatorial treatment with PLK1i, AURKAi, and AURKBi. NP460 cells were incubated with a combination of PLK1i (2.5 nM), AURKAi (250 nM), and AURKBi (25 nM). After 24 h, the cells were harvested and analyzed with flow cytometry. (C) C666-1 cells are sensitive to co-inhibition of PLK1 and Aurora kinases. C666-1 cells were incubated with a combination of PLK1i (2.5 nM), AURKAi (500 nM), and AURKBi (20 nM). After 48 h, the cells were harvested and analyzed with flow cytometry. (D) PLK1i cooperates with Aurora kinase inhibitors to induce mitotic arrest and slippage. HONE1 cells expressing histone H2B-mRFP were incubated with PLK1i (2.5 nM), AURKAi (250 nM), and AURKBi (25 nM). Individual cells were then tracked for 24 h with time-lapse microscopy (the fate of individual cells was shown in Supplementary Figure S5A). The duration of mitosis (from prometaphase–anaphase) was quantified (average ±90% CI; n = 50). The percentage of cells that underwent mitotic slippage was also quantified (lower panel).
Figure 7
Figure 7. Small-molecule inhibitors and siRNAs of PLK1 and Aurora kinases act synergistically
(A) Depletion of Aurora kinases increased the sensitivity to PLK1i. HONE1 cells were transfected with control siRNA, siAURKA, or siAURKB. After 24 h, the cells were treated with either buffer or PLK1i (2.5 nM). After 24 h, the cells were harvested and analyzed with flow cytometry. (B) Depletion of PLK1 increased the sensitivity to Aurora kinase inhibitors. HONE1 cells were transfected with either control siRNA or siPLK1. After 24 h, the cells were treated with buffer, AURKAi (500 nM), or AURKBi (10 nM). After 24 h, the cells were harvested and analyzed with flow cytometry.

References

    1. Ma HT, Poon RY. How protein kinases co-ordinate mitosis in animal cells. Biochem J. 2011;435:17–31. - PubMed
    1. Fung TK, Poon RY. A roller coaster ride with the mitotic cyclins. Semin Cell Dev Biol. 2005;16:335–42. - PubMed
    1. Lobjois V, Jullien D, Bouche JP, Ducommun B. The polo-like kinase 1 regulates CDC25B-dependent mitosis entry. Biochim Biophys Acta. 2009;1793:462–8. - PubMed
    1. Roshak AK, Capper EA, Imburgia C, Fornwald J, Scott G, Marshall LA. The human polo-like kinase, PLK, regulates cdc2/cyclin B through phosphorylation and activation of the cdc25C phosphatase. Cell Signal. 2000;12:405–11. - PubMed
    1. Toyoshima-Morimoto F, Taniguchi E, Nishida E. Plk1 promotes nuclear translocation of human Cdc25C during prophase. EMBO Rep. 2002;3:341–8. - PMC - PubMed

Publication types

MeSH terms

Substances

LinkOut - more resources