. 2015 Apr 20;6(11):8788-806.
doi: 10.18632/oncotarget.3554.

Targeted therapy of glioblastoma stem-like cells and tumor non-stem cells using cetuximab-conjugated iron-oxide nanoparticles

Affiliations

Targeted therapy of glioblastoma stem-like cells and tumor non-stem cells using cetuximab-conjugated iron-oxide nanoparticles

Milota Kaluzova et al. Oncotarget. .

Abstract

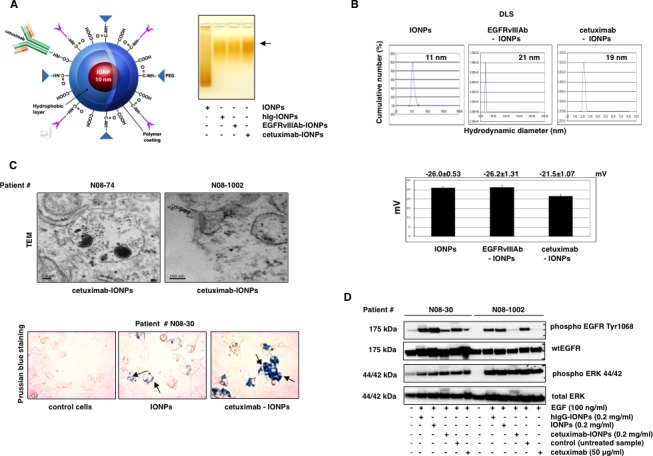
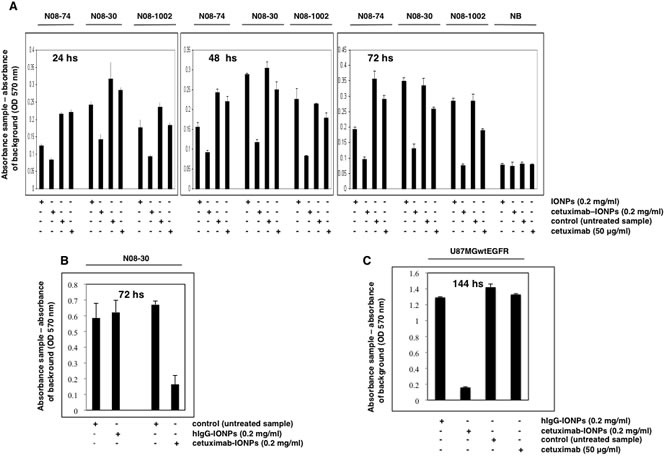
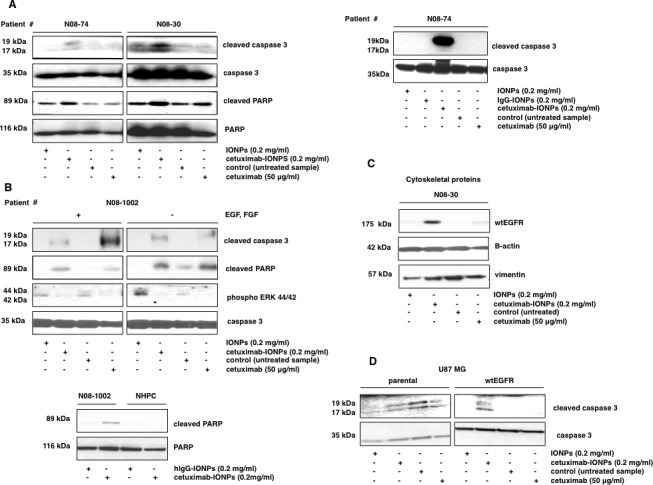
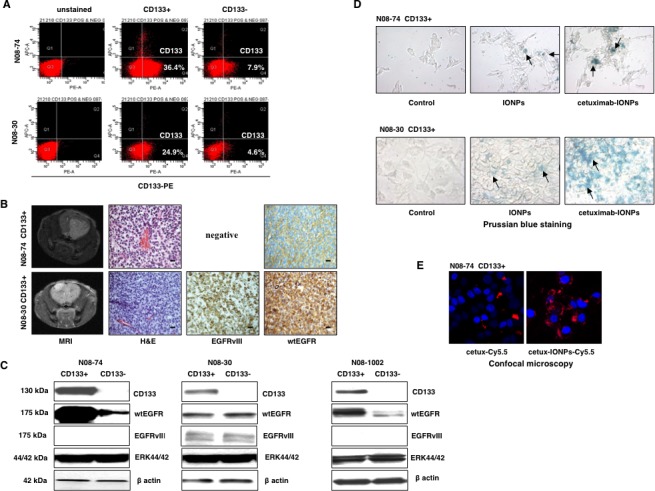
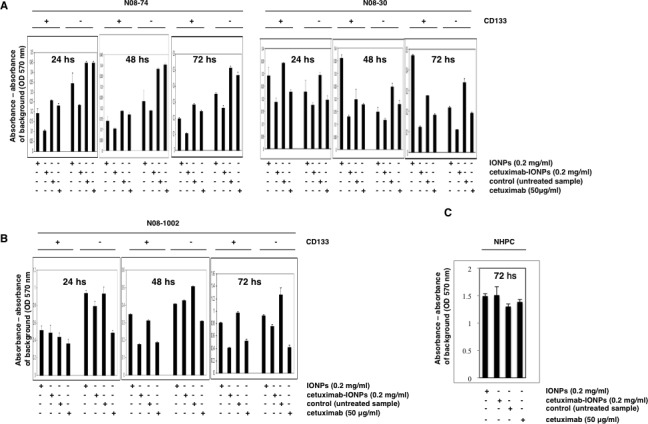
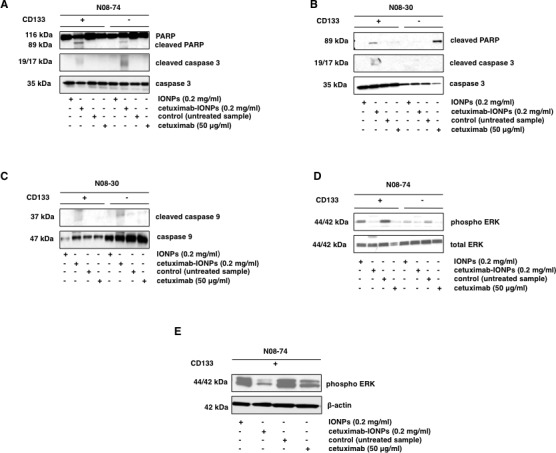
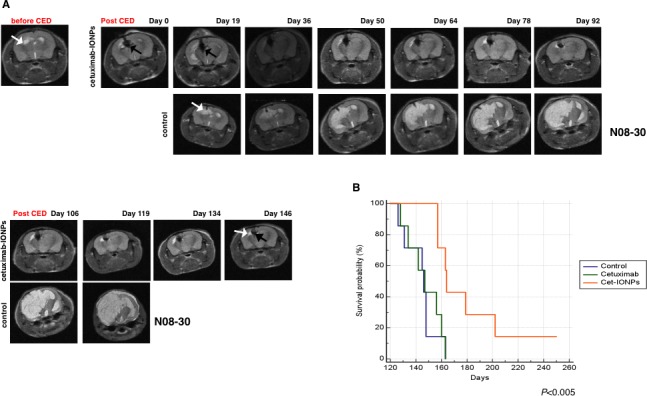
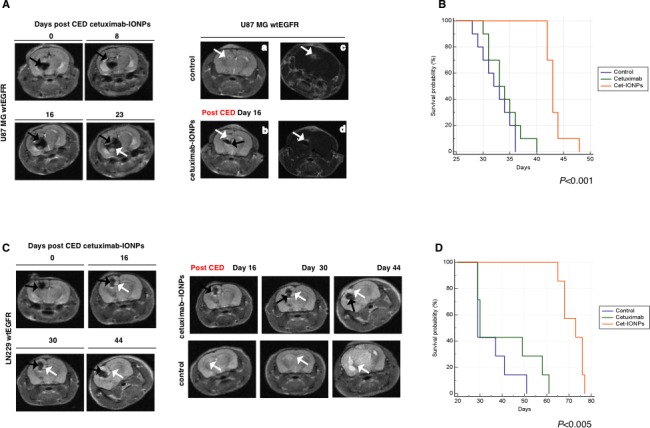
Malignant gliomas remain aggressive and lethal primary brain tumors in adults. The epidermal growth factor receptor (EGFR) is frequently overexpressed in the most common malignant glioma, glioblastoma (GBM), and represents an important therapeutic target. GBM stem-like cells (GSCs) present in tumors are felt to be highly tumorigenic and responsible for tumor recurrence. Multifunctional magnetic iron-oxide nanoparticles (IONPs) can be directly imaged by magnetic resonance imaging (MRI) and designed to therapeutically target cancer cells. The targeting effects of IONPs conjugated to the EGFR inhibitor, cetuximab (cetuximab-IONPs), were determined with EGFR- and EGFRvIII-expressing human GBM neurospheres and GSCs. Transmission electron microscopy revealed cetuximab-IONP GBM cell binding and internalization. Fluorescence microscopy and Prussian blue staining showed increased uptake of cetuximab-IONPs by EGFR- as well as EGFRvIII-expressing GSCs and neurospheres in comparison to cetuximab or free IONPs. Treatment with cetuximab-IONPs resulted in a significant antitumor effect that was greater than with cetuximab alone due to more efficient, CD133-independent cellular targeting and uptake, EGFR signaling alterations, EGFR internalization, and apoptosis induction in EGFR-expressing GSCs and neurospheres. A significant increase in survival was found after cetuximab-IONP convection-enhanced delivery treatment of 3 intracranial rodent GBM models employing human EGFR-expressing GBM xenografts.

Keywords: cetuximab; convection-enhanced delivery (CED); glioblastoma stem-like cells (GSCs); iron-oxide nanoparticles (IONPs); magnetic resonance imaging (MRI).


Conflict of interest statement

Disclosure of Potential Conflicts of Interest

No potential conflicts of interest were disclosed

Figures

Figure 1
Figure 1. Physicochemical characterization and in vitro uptake of the cetuximab-IONPs
(A, left) Illustration of amphiphilic triblock copolymer-coated IONPs conjugated to cetuximab. (A, right) Confirmation of conjugation of IONPs to cetuximab, EGFRvIIIAb, and a human IgG by mobility shift (black arrow) in 1% agarose gel. (B, top) Dynamic light scattering (DLS) and hydrodynamic diameter of IONPs, cetuximab-IONPs, and EGFRvIIIAb-IONPs. (B, bottom) Zeta potential of IONPs, EGFRvIIIAb-IONPs, and cetuximab-IONPs. (C, top) Transmission electron microscopy (TEM) studies of cell binding and internalization of cetuximab-IONPs into lysosomes of human GBM neurospheres N08-74 and N08-1002 (magnification 10,000x). (C, bottom) Prussian blue staining of control (no treatment), IONPs, and cetuximab-IONPs internalized by human GBM neurospheres N08-30 (representative slides are shown). Neurospheres were allowed to attach to cell culture dish after treatment in neurobasal media. Nanoparticles are indicated by black arrows, magnification 40x. Cetuximab-IONPs showed maximal uptake. (D) Effect of cetuximab-IONPs on phosphorylation of EGFR after activation with EGF. Human GBM neurospheres N08-30 and N08-1002 were starved for 24 hs, pretreated with cetuximab-IONPs, IONPs, hIgG-IONPs, or cetuximab for 3 hs, followed by activation with 100 ng/ml EGF for 15 min. Western blotting with phospho-EGFR Y1068 antibody shows decreased activation of EGFR in the presence of cetuximab-IONPs. Total ERK 44/42 was used as an internal control.
Figure 2
Figure 2. Cytotoxicity of cetuximab-IONPs in human GBM neurospheres and U87MGwtEGFR GBM cell line and quantification by an MTT assay
(A) Neurospheres N08-74, N08-30, and N08-1002 (3×10⁴ cells per well) and normal brain cells (NB, 5×10³) were treated with free IONPs (0.2 mg/ml), cetuximab-IONPs (0.2 mg/ml), control vehicle, or cetuximab alone (50 μg/ml) and MTT assay was performed after 24, 48, and 72 hs (GBM neurospheres) or 72 hs (normal brain cells). A significant decrease in cell survival was observed in GBM neurospheres treated with cetuximab-IONPs for 72 hs (P<0.001). No cytotoxicity was observed in normal brain cells after 72 hs. (B) Neurospheres N08-30 were treated with 0.2 mg/ml cetuximab-IONPs or IgG-IONPs for 72 hs when an MTT assay was performed. Only cetuximab-IONPs displayed increased cytotoxicity (P<0.001). (C) U87MGwtEGFR cells (5×10³) were treated with hIgG-IONPs (0.2 mg/ml), cetuximab-IONPs (0.2 mg/ml), control vehicle, or cetuximab alone (50 μg/ml) for 144 hs. A significant decrease in cell survival was found in U87MGwtEGFR GBM cell treated with the cetuximab-IONPs (P<0.001). In all experiments, neurospheres and other cells were used in early passage.
Figure 3
Figure 3. Apoptosis in human GBM neurospheres containing GSCs treated with cetuximab-IONPs
Transport of EGFR to the cytoskeletal structures. Neurospheres were treated with free IONPs (0.2 mg/ml), cetuximab-IONPs (0.2 mg/ml), control vehicle, or cetuximab alone (50 μg/ml) and expression of apoptotic proteins was evaluated by Western blotting. Elevated levels of cleaved caspase 3 and cleaved PARP were found in neurospheres N08-74 and N08-30 after treatment with cetuximab-IONPs for 3 (A, left) and in neurospheres N08-74 for 14 hs (A, right). Treatment with cetuximab-IONPs was most effective in inducing cleavage of caspase 3 and PARP although some caspase 3 cleavage was also induced by free IONPs in N08-30. In neurospheres N08-1002, induction of caspase 3 and PARP cleavage, and decreased phosphorylation of ERK 44/42 was found after 3 h treatment with cetuximab-IONPs and cetuximab alone, both in the presence and absence of EGF and FGF, caspase 3 was used as a control (B, top). Treatment with cetuximab-IONPs (but not the control conjugated antibody) increased cleavage of PARP in neurospheres N08-1002 whereas no cleavage was observed in NHPC (B, bottom). (C) N08-30 neurospheres were treated as above for 5 hs, lysates were subcellularly fractionated, and analyzed by Western blotting. Elevated levels of wtEGFR were found in the cytoskeletal fraction after cells were treated with cetuximab-IONPs. (D) U87MG and U87MGwtEGFR human GBM cell lines were treated with free IONPs, cetuximab-IONPs, or cetuximab alone. Apoptosis, as indicated by activation of caspase 3 cleavage, was seen only in the U87MGwtEGFR cell line treated with cetuximab-IONPs.
Figure 4
Figure 4. Molecular profile and characterization of human GSCs
(A) FACS analysis of human GSCs (CD133-positive) and GBM CD133-negative neurospheres from patients N08-74 and N08-30. (B) MRI, hematoxylin and eosin (H&E), and immunohistochemistry staining of EGFRvIII and wtEGFR in orthotopic human GBM xenografts generated in nude/athymic mice after intracranial implantation of N08-74 and N08-30 GSCs, scale bars, 100 μm (magnification 40x). (C) Expression profile of selected proteins probed by Western blotting in human GSCs (CD133-positive) and GBM CD133-negative neurospheres from patients N08-74, N08-30, and N08-1002, total ERK 44/42 and β-actin were used as internal controls. (D) Prussian blue staining of IONPs and cetuximab-IONPs internalized by N08-74 and N08-30 GSCs (representative slides are shown). After 24 h treatment, neurospheres were allowed to attach to cell culture dish in neurobasal media and stained (nanoparticles are indicated by black arrows, magnification 40x). Cetuximab-IONPs showed maximal uptake in N08-74 and N08-30 GSCs. (E) Confocal microscopy of cetuximab-Cy5.5 and cetuximab-IONPs-Cy5.5 internalized by N08-74 GSCs. After 4 h treatment, GSCs were allowed to attach to culture slides, fixed, and imaged using Zeiss LSM 510 Meta Confocal microscope. Cy5.5, pseudo-colored red; DAPI, pseudo-colored blue (maximum intensity projection, magnification 100x).
Figure 5
Figure 5. Cytotoxicity of cetuximab-IONPs in human GSCs and GBM CD133-negative cells quantified by MTT assay
Human GSCs harvested from neurospheres N08-74, N08-30 (A), and N08-1002 (B) (3×10⁴ cells per well), GBM CD133-negative cells (3×10⁴), and NHPC (C) were treated with free IONPs (0.2 mg/ml), cetuximab-IONPs (0.2 mg/ml), control vehicle, or cetuximab (50 μg/ml). MTT assay was performed after 24, 48, and 72 hs (GSCs and GBM CD133-negative cells) or 72 hs (NHPC). A significant decrease in cell survival was found in all human GSCs treated with the cetuximab-IONPs for 72 hs (P<0.001); cetuximab-IONPs also decreased, to a lesser degree, the survival of human GBM CD133-negative cells after 72 hs (P<0.001). No cytotoxicity was observed in NHPC cells after 72 hs.
Figure 6
Figure 6. Apoptosis studies and cell signaling in human GSCs after treatment with cetuximab-IONPs
GSCs and GBM CD133-negative neurospheres (5×10⁵ cells) from N08-74 (A) and N08-30 (B) were treated with free IONPs, cetuximab-IONPs, and cetuximab for 3 hs and expression of cleaved caspase 3, caspase 3, cleaved PARP, and PARP was determined by Western blot analysis. (C) Expression of cleaved caspase 9, caspase 9 after 3 h treatment in GSCs and GBM CD133-negative neurospheres (5×10⁵ cells) from N08-30. GSCs and GBM CD133-negative cells from neurospheres N08-74 were treated with free IONPs (0.2 mg/ml), cetuximab-IONPs (0.2 mg/ml), or cetuximab (50 μg/ml) for 3 hs and analyzed by Western blotting with phospho-ERK44/42 and total ERK44/42 antibodies (D) or GSCs from N08-74 for 72 hs (E) and analyzed by Western blotting with phospho-ERK44/42 and β-actin antibodies.
Figure 7
Figure 7. Animal survival studies after CED treatment with cetuximab-IONPs in a human GBM neurosphere model
Mice intracranially implanted with EGFR-expressing human GBM neurospheres were subjected to CED with cetuximab-IONPs. (A) T2 weighted MRI before CED and days 0, 19, 36, 50, 64, 78, 92, 106, 119, 134, 146 after CED revealed the presence of cetuximab-IONPs (black arrow) and a very small tumor (top and bottom, upper panel, white arrow) in comparison with control mouse (top and bottom, lower panel). (B) Kaplan-Meier survival curve of athymic nude mice intracranially implanted with human GBM neurospheres and CED treated with control, cetuximab, and cetuximab-IONPs. Statistical significance was estimated by log-rank method (P<0.005).
Figure 8
Figure 8. Animal survival studies after CED treatment with cetuximab-IONPs in human GBM U87MGwtEGFR and LN229wtEGFR models
Mice implanted with GBM cell lines (EGFR-expressing U87MGwtEGFR and LN229wtEGFR) to form orthotopic human GBM xenografts underwent CED with cetuximab-IONPs. (A left) T2 weighted MRI revealed the presence of cetuximab-IONPs (black arrows) and their distribution and dispersion on days 0, 8, 16, and 23, white arrow indicates intracranial U87MGwtEGFR xenograft. (A right) Examples of T2 weighted MRI of mice brains showing a GBM xenograft with a bright signal (white arrow) post tumor implantation (day 16) (a); MRI signal drop (black arrow) after cetuximab-IONPs CED (b). Tumor contrast enhancement after administration of gadolinium contrast agent in a control mouse (c) and a mouse treated with cetuximab-IONPs (d). White arrows indicate intracranial xenografts. (B) Kaplan-Meier survival curve of athymic nude mice intracranially implanted with U87MGwtEGFR cells and CED-treated with control, cetuximab, or cetuximab-IONPs. Statistical significance was estimated by log-rank method (P<0.001). (C left) T2 weighted MRI revealed the presence of cetuximab-IONPs (black arrows) and their distribution and dispersion on days 0, 16, 30, and 44 after CED, white arrow indicates intracranial LN229wtEGFR xenograft. (C right) T2 weighted MRI day 16, 30, 44 after CED revealed the presence of cetuximab-IONPs (black arrow) and a small tumor (top panel, white arrow,) in comparison with control mouse (bottom panel, white arrow). (D) Kaplan-Meier survival curve of athymic nude mice intracranially implanted with LN229wtEGFR cells and CED-treated with control, cetuximab and cetuximab-IONPs. Statistical significance was estimated by log-rank method (P<0.005).

References

    1. Van Meir EG, Hadjipanayis CG, Norden AD, Shu HK, Wen PY, Olson JJ. Exciting new advances in neuro-oncology: the avenue to a cure for malignant glioma. CA Cancer J Clin. 2010;60(3):166–193. - PMC - PubMed
    1. Louis DN, Ohgaki H, Wiestler OD, Cavenee WK, Burger PC, Jouvet A, Scheithauer BW, Kleihues P. The 2007 WHO classification of tumours of the central nervous system. Acta Neuropathol. 2007;114(2):97–109. - PMC - PubMed
    1. Charles NA, Holland EC, Gilbertson R, Glass R, Kettenmann H. The brain tumor microenvironment. Glia. 2011;59(8):1169–1180. - PubMed
    1. Jackson C, Ruzevick J, Phallen J, Belcaid Z, Lim M. Challenges in immunotherapy presented by the glioblastoma multiforme microenvironment. Clin Dev Immunol. 2011;2011:732413. - PMC - PubMed
    1. Chen J, Li Y, Yu TS, McKay RM, Burns DK, Kernie SG, Parada LF. A restricted cell population propagates glioblastoma growth after chemotherapy. Nature. 2012;488(7412):522–526. - PMC - PubMed

Publication types

MeSH terms