

Local Gradients in Electrotonic Loading Modulate the Local Effective Refractory Period: Implications for Arrhythmogenesis in the Infarct Border Zone
- PMID: 25872206
- PMCID: PMC5395087
- DOI: 10.1109/TBME.2015.2421296
Local Gradients in Electrotonic Loading Modulate the Local Effective Refractory Period: Implications for Arrhythmogenesis in the Infarct Border Zone
Abstract
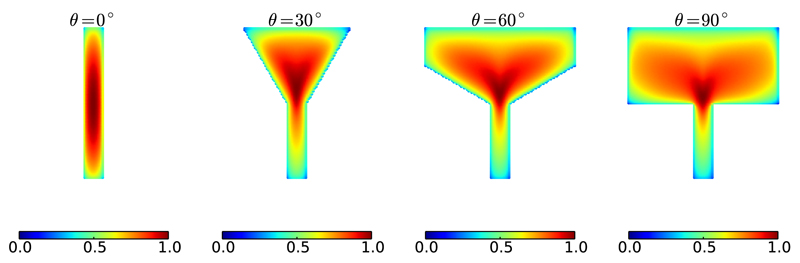
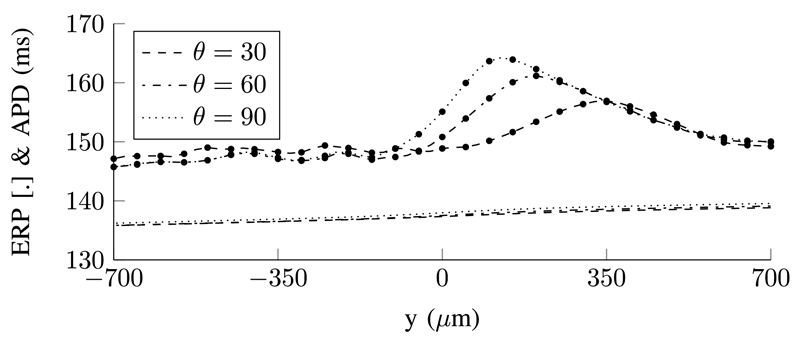
Ectopic electrical activity that originates in the peri-infarct region can give rise to potentially lethal re-entrant arrhythmias. The spatial variation in electrotonic loading that results from structural remodelling in the infarct border zone may increase the probability that focal activity will trigger electrical capture, but this has not previously been investigated systematically. This study uses in-silico experiments to examine the structural modulation of effective refractory period on ectopic beat capture. Informed by 3-D reconstructions of myocyte organization in the infarct border zone, a region of rapid tissue expansion is abstracted to an idealized representation. A novel metric is introduced that defines the local electrotonic loading as a function of passive tissue properties and boundary conditions. The effective refractory period correlates closely with local electrotonic loading, while the action potential duration, conduction, and upstroke velocity reduce in regions of increasing electrotonic load. In the presence of focal ectopic stimuli, spatial variation in effective refractory period can cause unidirectional conduction block providing a substrate for reentrant arrhythmias. Consequently, based on the observed results, a possible novel mechanism for arrhythmogenesis in the infarct border zone is proposed.
Figures


Similar articles
-
Computational Representations of Myocardial Infarct Scars and Implications for Arrhythmogenesis.Clin Med Insights Cardiol. 2016 Jul 26;10(Suppl 1):27-40. doi: 10.4137/CMC.S39708. eCollection 2016. Clin Med Insights Cardiol. 2016. PMID: 27486348 Free PMC article. Review.
-
Structural heterogeneity modulates effective refractory period: a mechanism of focal arrhythmia initiation.PLoS One. 2014 Oct 7;9(10):e109754. doi: 10.1371/journal.pone.0109754. eCollection 2014. PLoS One. 2014. PMID: 25291380 Free PMC article.
-
Cardiac intramural electrical mapping reveals focal delays but no conduction velocity slowing in the peri-infarct region.Am J Physiol Heart Circ Physiol. 2019 Oct 1;317(4):H743-H753. doi: 10.1152/ajpheart.00154.2019. Epub 2019 Aug 16. Am J Physiol Heart Circ Physiol. 2019. PMID: 31419152
-
Altered adrenergic response in myocytes bordering a chronic myocardial infarction underlies in vivo triggered activity and repolarization instability.J Physiol. 2020 Jul;598(14):2875-2895. doi: 10.1113/JP278839. Epub 2020 Feb 11. J Physiol. 2020. PMID: 31900932 Free PMC article.
-
Propagation of pacemaker activity.Med Biol Eng Comput. 2007 Feb;45(2):177-87. doi: 10.1007/s11517-006-0102-9. Epub 2006 Sep 2. Med Biol Eng Comput. 2007. PMID: 16951930 Review.
Cited by
-
Determining anatomical and electrophysiological detail requirements for computational ventricular models of porcine myocardial infarction.Comput Biol Med. 2022 Feb;141:105061. doi: 10.1016/j.compbiomed.2021.105061. Epub 2021 Nov 26. Comput Biol Med. 2022. PMID: 34915331 Free PMC article.
-
Ventricular fibrillation/ventricular tachycardia within 72 h of VA-ECMO: incidence, outcomes, risk factors, and management.ESC Heart Fail. 2024 Feb;11(1):524-532. doi: 10.1002/ehf2.14615. Epub 2023 Dec 13. ESC Heart Fail. 2024. PMID: 38088144 Free PMC article.
-
Computational Representations of Myocardial Infarct Scars and Implications for Arrhythmogenesis.Clin Med Insights Cardiol. 2016 Jul 26;10(Suppl 1):27-40. doi: 10.4137/CMC.S39708. eCollection 2016. Clin Med Insights Cardiol. 2016. PMID: 27486348 Free PMC article. Review.
-
Personalized Cardiac Computational Models: From Clinical Data to Simulation of Infarct-Related Ventricular Tachycardia.Front Physiol. 2019 May 15;10:580. doi: 10.3389/fphys.2019.00580. eCollection 2019. Front Physiol. 2019. PMID: 31156460 Free PMC article.
-
A comprehensive protocol combining in vivo and ex vivo electrophysiological experiments in an arrhythmogenic animal model.Am J Physiol Heart Circ Physiol. 2024 Jan 1;326(1):H203-H215. doi: 10.1152/ajpheart.00358.2023. Epub 2023 Nov 17. Am J Physiol Heart Circ Physiol. 2024. PMID: 37975708 Free PMC article.
References
-
- el Sherif N, et al. Reentrant ventricular arrhythmias in the late myocardial infarction period: Spontaneous versus induced reentry and intramural versus epicardial circuits. J Amer Coll Cardiol. 1985;6(1):124–132. - PubMed
-
- de Bakker JMT, et al. Slow conduction in the infarcted human heart—Zigzag course of activation. Circulation. 1993;88(3):915–926. - PubMed
-
- Rutherford SL, et al. High-resolution 3-dimensional reconstruction of the infarct border zone: Impact of structural remodeling on electrical activation. Circulation Res. 2012;111(3):301–311. - PubMed
-
- Antzelevitch C. Basic mechanisms of reentrant arrhythmias. Curr Opin Cardiol. 2001;16(1):1–7. - PubMed
Publication types
MeSH terms
Grants and funding
LinkOut - more resources
Full Text Sources
Medical
