. 2015 Apr 14;8(372):ra34.
doi: 10.1126/scisignal.aaa5903.

The mTORC1/4E-BP pathway coordinates hemoglobin production with L-leucine availability

Affiliations

The mTORC1/4E-BP pathway coordinates hemoglobin production with L-leucine availability

Jacky Chung et al. Sci Signal. .

Abstract

In multicellular organisms, the mechanisms by which diverse cell types acquire distinct amino acids and how cellular function adapts to their availability are fundamental questions in biology. We found that increased neutral essential amino acid (NEAA) uptake was a critical component of erythropoiesis. As red blood cells matured, expression of the amino acid transporter gene Lat3 increased, which increased NEAA import. Inadequate NEAA uptake by pharmacologic inhibition or RNAi-mediated knockdown of LAT3 triggered a specific reduction in hemoglobin production in zebrafish embryos and murine erythroid cells through the mTORC1 (mammalian target of rapamycin complex 1)/4E-BP (eukaryotic translation initiation factor 4E-binding protein) pathway. CRISPR-mediated deletion of members of the 4E-BP family in murine erythroid cells rendered them resistant to mTORC1 and LAT3 inhibition and restored hemoglobin production. These results identify a developmental role for LAT3 in red blood cells and demonstrate that mTORC1 serves as a homeostatic sensor that couples hemoglobin production at the translational level to sufficient uptake of NEAAs, particularly L-leucine.


Conflict of interest statement

Competing interests: The authors declare that they have no competing interests.

Figures

Figure 1
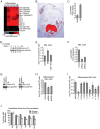
Figure 1. Erythropoiesis involves increased NEAA uptake mediated by increased Lat3 expression
(A) RNAseq gene expression analysis (accession number GSE32110) of fetal liver cells as they mature from R1 to R5 stages, showing induction of LAT3 mRNA with other terminal erythroid transcripts. CD98, the required co-transporter for LAT1 and LAT2, was not detected at any differentiation stage. (B and C) Lat3 mRNA expression was examined in the murine embryo at E14.5 by radiolabelled in situ hybridization (pseudo-colored red) (B) and in differentiating MEL cells by qRT-PCR (C), showing enrichment of Lat3 mRNA in erythropoietic tissues and during erythroid maturation. (D) Lysates from undifferentiated and differentiating MEL cells induced with DMSO at various days were immunoblotted with anti-LAT3 or anti-GAPDH antibodies. (E to I) The uptake of [3H]-L-leucine was monitored over 4 minutes in the indicated MEL cell populations (E), in differentiating (Day 3) control or stably Lat3 shRNA-expressing MEL cells (F to H), or in differentiating (Day 3) MEL cells treated with the indicated non-radioactive amino acids (I). For (I), * denotes significant difference from MOCK treatment. (J) GC-MS analysis of maturing MEL cells stably expressing control or Lat3-targeting shRNAs. The percentage of each amino acid was normalized to the corresponding undifferentiated samples. *p-value < 0.05. Mean ± SEM, n = 3 independent experiments for (C), (E), (F), (H), (I), and (J). N= 2 embryos for (B). N= 2 independent experiments for (D) and (G). FL: fetal liver; IB: immunoblot; Undiff: undifferentiated; Diff: differentiated; shRNA: short-hairpin RNA; BCH: 2-aminobicyclo-(2,2,1)-heptane-2-carboxylic acid.
Figure 2
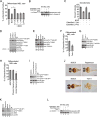
Figure 2. NEAA insufficiency reduces hemoglobinization of erythroid cells
(A and B) In situ hybridization using probes specific for lat3a, lat3b, or gata-1 was performed on 24 hpf wild-type embryos (A) or mutant fish (B). ICM, red arrowheads; somites are positioned dorsal to the ICM at this developmental stage, black arrowhead. An enlarged view of the posterior ICM is provided in the bottom left corner of each panel (A). Scale bar represents 0.2 μm. (C to F) Total RNA was isolated from control or morphant 72 hpf zebrafish embryos and quantitative PCR analysis was performed (C). Control or morphant embryos from Tg(globin-LCR:eGFP) (D) or Tg(gata-1:eGFP) (E) transgenic lines were analyzed by flow cytometry. Control or morphant wild-type (F) zebrafish were stained with o-dianisidine to examine hemoglobinization at 72 hpf. Scale bar represents 0.2 μm. (G and H) o-dianisidine staining was performed on MEL cells treated with BCH or control or stably Lat3 shRNA-expressing MEL cells. (I to J) Total RNA was isolated from differentiating fetal liver cells infected with lentiviruses expressing the indicated shRNAs and quantitative PCR was performed (I). These primary fetal liver cells were stained with o-dianisidine (J). *p-value < 0.05. Mean ± SEM, n = 3 independent experiments for (C), (D), (E), (G), (H), (I) and (J). Images in (A), (B), and (F) are representative of 2 independent experiments each consisting of at least 40 embryos per condition. shRNA: short-hairpin RNA; MO: morpholino; hpf: hours post-fertilization; BCH: 2-aminobicyclo-(2,2,1)-heptane-2-carboxylic acid.
Figure 3
Figure 3. α/β-globin protein translation is preferentially reduced under limiting NEAA availability
(A and B) Undifferentiated (Day 0) and maturing (Day 3 or 4) control or Lat3 shRNA expressing MEL cells were lysed and immunoblotted with the indicated antibodies. (C) Total RNA was isolated from undifferentiated (Day 0) and differentiating (Day 3) control or Lat3-shRNA expressing cells and semi-quantitative RT-PCR analysis for murine α-globin, βmajor-globin, and Hprt was performed. (D) Control or Lat3 shRNA expressing differentiating MEL cells were metabolically labeled with or without L-AHA. Nascent proteins were visualized by streptavidin-HRP and other proteins were detected by immunoblotting. (E and F) Polysome profiling followed by semi-quantitative RT-PCR was performed on differentiating control or Lat3 shRNA-expressing MEL cells at Day 3 of DMSO differentiation. A representative profile is shown in (E) where the upward arrow represents the start of fraction collection. Densitometry analysis was performed on results from three independent experiments and expressed as a percentage of total RNA (F). The graph shows mean ± SEM. (G) Non-radioactive metabolic labeling was performed on differentiating MEL cells (Day 3) treated with BCH. Nascent proteins were visualized using streptavidin-HRP and also immunoblotted with anti-α-globin antibody. n = 2 independent experiments for (A), (B), (D), and (G) and n = 3 for (C). IB: immunoblot; shRNA: short-hairpin RNA; L-AHA: L-azidohomoalanine; HRP: horseradish peroxidase.
Figure 4
Figure 4. mTORC1 senses sufficient NEAA uptake, particularly L-leucine, in maturing erythroid cells
(A) BCH treated MEL cells with or without various amino acid esters starting at Day 0 and were o-dianisidine stained for hemoglobinization at Day 4 of differentiation. (B and C) Non-radioactive metabolic labeling was performed on Day 3 differentiated MEL cells treated with the indicated combinations of BCH and esterified amino acids (B). Relative protein abundance was quantified by densitometry from three independent experiments and normalized to the total amount of α-globin protein (C). (D) Day 3 differentiating control or Lat3-shRNA expressing cell lysates were immunoblotted with the indicated antibodies. (E) Lysates isolated from control or lat3a-MO2 injected zebrafish embryos were immunoblotted with the indicated antibodies. (F to I) MEL cells were treated with torin 1 (F and G) or rapamycin (H and I) and analyzed by o-dianisidine staining (F and H) or western blotting (G and I). (J and K) Zebrafish embryos were treated with the indicated compounds and stained with o-dianisidine (J) or lysed and analyzed by western blotting (K). Scale bar in (J) represents 0.2 μm. (L) Non-radioactive metabolic labeling was performed on Day 3 differentiating MEL cells treated with the indicated combinations of torin 1 and esterified amino acids. *p-value < 0.05. Mean ± SEM, n = 3 independent experiments for (A), (C), (F), and (H). N = 2 independent experiments in (D), (E), (G), (I), (K), and (L). Images in (J) are representative of 2 independent experiments with at least 40 embryos per treatment. IB: immunoblot; shRNA: short-hairpin RNA; L-AHA: L-azidohomoalanine; HRP: horseradish peroxidase.
Figure 5
Figure 5. α/β-globin transcripts are direct mTORC1 translational targets
(A) The most frequent transcription start site (TSS) of murine and human α/β-globin mRNAs were analyzed using data from RefSeq, ENSEMBL, and UCSC databases for the presence of a 5′ terminal oligopyrimidine tract (TOP)-like motif or a pyrimidine rich translational element (PRTE). (B) Non-radioactive metabolic labeling was performed on differentiating MEL cells (Day 3) treated with torin 1. Nascent proteins were visualized using streptavidin-HRP and also immunoblotted with anti-α-globin antibody. N = 2 independent experiments. (C and D) Polysome profiling and semi-quantitative PCR were performed on differentiating control or torin 1-treated (2 hours) MEL cells at Day 3 of DMSO differentiation. A representative profile is shown in (C) where the upward arrow denotes the start of fraction collection. Densitometry analysis was performed on results from three independent experiments normalized to total mRNA expression (D). The graph shows mean ± SEM. IB: immunoblot; L-AHA: L-azidohomoalanine; HRP: horseradish peroxidase.
Figure 6
Figure 6. α/β-globin protein translation is regulated by 4E-BP proteins
(A) Differentiating MEL cells at Day 4 were stained with o-dianisidine after treatment with 4EGI-1 or DG2. (B) Zebrafish embryos at 72 hpf were treated with the 4E-BP mimetic 4EGI-1 and stained for hemoglobinization with o-dianisidine. Scale bar represents 0.2 μm. (C and D) Wild type or DKO (deficient for both eif4ebp1 and eif4ebp2) MEL cells were differentiated with or without BCH (C) or torin 1 (D) and stained with o-dianisidine. (E to H) Non-radioactive metabolic labeling experiments were performed with L-AHA on wild type or DKO cells with short-term BCH (E and F) or torin 1 (G and H) treatment. Proteins were detected by immunoblotting with the indicated antibodies while biotinylated, nascent proteins were detected using a streptavidin-HRP conjugate (E and G). Densitometry analysis was performed on three independent experiments (F and H). Nascent α/β-globin protein synthesis was normalized to α-globin protein expression. (I and J) Non-radioactive metabolic labeling was performed on Day 3 differentiated DKO MEL cells treated with the indicated combinations of BCH (I) or torin 1 (J) and esterified amino acids. *p-value < 0.05. Mean ± SEM, n = 3 independent experiments for (A), (C), (D), (F), and (H). Images in (B) are representative of 2 independent experiments with at least 40 embryos per treatment. N= 2 independent experiments for (I) and (J). IB: immunoblot; L-AHA: L-azidohomoalanine; HRP: horseradish peroxidase.
Figure 7
Figure 7. mTORC1 coordinates hemoglobin translation with sufficient NEAA uptake, particularly L-leucine, during erythropoiesis
A schematic depicting our model in which maturing erythroid cells rely on LAT3-mediated NEAA uptake to maintain homeostasis. In the absence of adequate uptake, reduced NEAA content, particularly L-leucine, triggers a reduction in mTORC1/4E-BP signalling and subsequent repression in translation for globin proteins. This mechanism is distinct from the previously identified eIF2α-dependent mechanism that becomes activated with severe amino acid deprivation (GCN2) or heme availability (HRI).

Comment in

References

    1. Bose T, Lee KK, Lu S, Xu B, Harris B, Slaughter B, Unruh J, Garrett A, McDowell W, Box A, Li H, Peak A, Ramachandran S, Seidel C, Gerton JL. Cohesin proteins promote ribosomal RNA production and protein translation in yeast and human cells. PLoS Genet. 2012;8:e1002749. doi: 10.1371/journal.pgen.1002749. - DOI - PMC - PubMed
    1. Kelleher RJ, 3rd, Bear MF. The autistic neuron: troubled translation? Cell. 2008;135:401–406. doi: 10.1016/j.cell.2008.10.017. published online EpubOct 31. - DOI - PubMed
    1. Sheen JH, Zoncu R, Kim D, Sabatini DM. Defective regulation of autophagy upon leucine deprivation reveals a targetable liability of human melanoma cells in vitro and in vivo. Cancer cell. 2011;19:613–628. doi: 10.1016/j.ccr.2011.03.012. published online EpubMay 17. - DOI - PMC - PubMed
    1. Xu B, Lee KK, Zhang L, Gerton JL. Stimulation of mTORC1 with L-leucine rescues defects associated with Roberts syndrome. PLoS Genet. 2013;9:e1003857. doi: 10.1371/journal.pgen.1003857. - DOI - PMC - PubMed
    1. Payne SH, Loomis WF. Retention and loss of amino acid biosynthetic pathways based on analysis of whole-genome sequences. Eukaryotic cell. 2006;5:272–276. doi: 10.1128/EC.5.2.272-276.2006. published online EpubFeb. - DOI - PMC - PubMed

Publication types

MeSH terms