. 2015 Oct;40(11):2576-87.
doi: 10.1038/npp.2015.104. Epub 2015 Apr 15.

Altered Corticostriatal Connectivity and Exploration/Exploitation Imbalance Emerge as Intermediate Phenotypes for a Neonatal Dopamine Dysfunction

Affiliations

Altered Corticostriatal Connectivity and Exploration/Exploitation Imbalance Emerge as Intermediate Phenotypes for a Neonatal Dopamine Dysfunction

Barbara Y Braz et al. Neuropsychopharmacology. 2015 Oct.

Abstract

Findings showing that neonatal lesions of the forebrain dopaminergic system in rodents lead to juvenile locomotor hyperactivity and learning deficits have been taken as evidence of face validity for the attention deficit hyperactivity disorder. However, the core cognitive and physiological intermediate phenotypes underlying this rodent syndrome remain unknown. Here we show that early postnatal dopaminergic lesions cause long-lasting deficits in exploitation of shelter, social and nutritional resources, and an imbalanced exploratory behavior, where nondirected local exploration is exacerbated, whereas sophisticated search behaviors involving sequences of goal directed actions are degraded. Importantly, some behavioral deficits do not diminish after adolescence but instead worsen or mutate, particularly those related to the exploration of wide and spatially complex environments. The in vivo electrophysiological recordings and morphological reconstructions of striatal medium spiny neurons reveal corticostriatal alterations associated to the behavioral phenotype. More specifically, an attenuation of corticostriatal functional connectivity, affecting medial prefrontal inputs more markedly than cingulate and motor inputs, is accompanied by a contraction of the dendritic arbor of striatal projection neurons in this animal model. Thus, dopaminergic neurons are essential during postnatal development for the functional and structural maturation of corticostriatal connections. From a bottom-up viewpoint, our findings suggest that neuropsychiatric conditions presumably linked to developmental alterations of the dopaminergic system should be evaluated for deficits in foraging decision making, alterations in the recruitment of corticostriatal circuits during foraging tasks, and structural disorganization of the frontostriatal connections.


Figures

Figure 1
Figure 1
Setting-dependent alteration of exploratory behavior in adulthood after neonatal DAN lesion. (a) Standard open field. No difference was observed in total traveled distance (t-test, t31=−0.16, P=0.9), distance in the center (t-test, t31=0.6, P=0.6), and maximal velocity (Mann–Whitney U=116, P=0.5). (b) Small arena. DAN-lesioned mice showed normal grooming but lower grooming induction (RM ANOVA, interaction: F1, 55=7, P=0.01, *P<0.05 Tukey's post hoc test). Vertical activity was increased in both conditions (RM ANOVA, treatment effect: F1, 55=15, *P<0.001). (c) Marble burying. DAN-lesioned mice showed lower levels of burying across time (RM ANOVA, interaction: F6, 131=8.5, P<0.001, Tukey's post hoc test *P<0.05, **P<0.001). Representative pictures at the end of the test are shown. (d) Elevated plus maze. DAN-lesioned mice traveled less along the maze (Mann–Whitney U=53, **P<0.001), spent more time in the open arms (RM ANOVA, interaction: F1, 87=26, P<0.001, Tukey's post hoc test **P<0.001), entered fewer times to the maze arms (RM ANOVA, interaction: F1, 87=11, P=0.002, Tukey's post hoc test *P<0.05 **P<0.001), and exhibited more (Mann–Whitney U=58, **P<0.001) and longer head dippings (Mann–Whitney U=20, **P<0.001). (e) Large arena. Total distance traveled was lower (Mann–Whitney U=0, **P<0.001) whereas latency to exit the first quadrant (Mann–Whitney U=1, **P<0.001) and to visit all quadrants was higher for the lesioned mice (Mann–Whitney U=0, **P<0.001). Right: DAN-lesioned mice showed increased local exploration in the form of a higher distance traveled by the head relative to the body (RM ANOVA, interaction: F5, 89=9, P<0.001, Tukey's post hoc test *P<0.05, **P<0.001). (f) Spontaneous alternation in Y maze. Total distance traveled in Y maze was lower (t-test, t31=2.7, *P=0.01), whereas latency to leave the first arm (Mann–Whitney U=25, **P<0.001) and to visit all arms (Mann–Whitney U=76, *P=0.032) was longer in lesioned than control mice. Moreover, number of entries to arms (Mann–Whitney U=59, *P=0.005) and alternation (t-test, t31=2.4, *P=0.02) were lower in lesioned mice. Data are mean±SEM, or median±interquartile ranges and 10–90th percentiles; animal numbers are indicated in parentheses.
Figure 2
Figure 2
Reduced exploitation in neonatally DAN-depleted animals when tested as adults. (a) Social interaction test. DAN-depleted mice showed lower sniffing levels directed to the unfamiliar mouse A (left; RM ANOVA, treatment factor: F1, 47=4.5, *P=0.046, chamber factor: F1, 47=23, **P<0.001) and failed to show an increase in social approach toward a novel conspecific (mouse B) (right; RM ANOVA, interaction: F1, 47=8.9, df=1, P=0.007; Tukey's post hoc test *P<0.05, **P<0.001). (b) Nesting. DAN-depleted mice used less material from the cotton nestlet (arrow) provided for the test (t-test, t23=3.6, **P=0.001). (c) Hoarding behavior. Photo of the behavioral setup: modified home cage connected with two 50 cm long tubes (see Results). From left to right: DAN-depleted mice hoarded less food (t-test, t13=3.1, *P=0.009), took longer to hoard all available pellets (Mann–Whitney U=7.5, *P=0.01), and visited fewer times the food and empty tubes (RM ANOVA, treatment effect: F1, 29=43, *P<0.001), but spent the same time in each tube than control mice (RM ANOVA). Data are mean±SEM; animal numbers are indicated in parentheses.
Figure 3
Figure 3
Exploration/exploitation deficits emerge in juvenile animals. (a) Small arena. DAN-lesioned mice showed an increase in spontaneous vertical activity (t-test, t18=−3.2, *P=0.004). (b) Marble burying. DAN-depleted mice showed lower levels of burying across time (RM ANOVA, interaction: F3, 87=9.9, P<0.001, Tukey's post hoc test *P<0.05, **P<0.001). (c) Nesting. DAN-lesioned mice used less material from the cotton nestlet provided for the test (Mann–Whitney, U=3, *P=0.001). (d) Large arena. No differences were observed in total traveled distance (t-test, t23=0.4, P=0.7), latency to exit the first quadrant (t-test, t23=−1.3, P=0.2), or latency to visit all quadrants (Mann–Whitney, U=47, P=0.1). DAN-lesioned mice showed increased local exploration in the first 5 min of the test (RM ANOVA, interaction: F5, 89=5.3, P<0.001, Tukey's post hoc test *P<0.05). (e) Y maze. Total distance traveled was lower (Mann–Whitney, U=7, **P<0.001) and latency to visit all arms longer (t-test, t18=−2.1, *P=0.047) in DAN-lesioned than control mice. The number of entries to arms were lower in lesioned mice (t-test, t19=5.6, P<0.001), and there was no difference in alternation between groups (t-test, t19=−1.7, P=0.1). (f) Hoarding behavior. From left to right: DAN-depleted mice hoarded less food (t-test, t13=3.1, *P=0.009) and visited fewer times both tubes (RM ANOVA, treatment effect: F1, 31= 9.9, *P=0.007, tube effect: F1, 31=6.7, P=0.02). The time spent in the tubes was lower in lesioned mice and both groups preferred the food arm (RM ANOVA, treatment effect: F1, 31=10.6, *P=0.006, tube effect: F1, 31=5.8, P=0.031). Data are mean±SEM, or median±interquartile ranges and 10–90th percentiles animal numbers are indicated in parentheses.
Figure 4
Figure 4
Functional corticostriatal disconnection in neonatally dopamine depleted animals. (a) Representative histological sections showing the location of cortical stimulation (left) and striatal recording (right) electrodes and representative trace of a striatal response evoked by cortical stimulation (aca, anterior commissure; St, striatum; cc, corpus callosum). Field potential amplitude was measured between the N2 and P2 peaks. Arrow points to location of the stimulating electrode. (b) Corticostriatal connectivity in adults. Top: Topographical reconstruction of recording sites. Colors represent the average field potential amplitude evoked by a cortical stimulation intensity of 300 μA. Middle: Cumulative frequency distribution and box and whisker plots (median with interquartile ranges and 10–90th percentiles) of evoked field potential amplitudes induced by 300 μA stimuli applied to the prelimbic cortex (Kolmogorov–Smirnov test **P<0.001). Bottom: Amplitude of the striatal field response (averaged for channels within the circle shown at the top) as a function of stimulation current intensity was diminished in adult DAN-lesioned mice (RM-ANOVA, interaction: F6, 132: 5.7, P<0.001, *P<0.05, **P<0.001 Tukey's post hoc test). (c) Corticostriatal connectivity in juvenile mice. Top, middle, and bottom panels as in (b). Middle: **P<0.001 (Kolmogorov–Smirnov test). (d) Representative traces of maximal local field potential responses (20 individual trials overlapped in gray, average trace in black). (e) Amplitude of the striatal field response was not affected by DA receptor antagonists (eticlopride 0.25 mg/kg and SCH23390 0.25 mg/kg, i.p.) (RM ANOVA). Data are mean±SEM, or median±interquartile ranges and 10–90th percentiles animal numbers are indicated in parentheses.
Figure 5
Figure 5
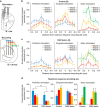
Disorganized response pattern to cortical inputs in dopamine neuron depleted mice. (a) Schematic diagram of the positioning of cortical stimulation electrodes and the striatal recording electrode (four shanks, eight channels per shank, channel separation: 100 μm). (b, c) Amplitude of the field potential responses evoked from prelimbic, cingulate, and motor cortex stimulation (700 μA) in different striatal regions (shanks) in control (b) and DAN-lesioned mice (c). Responses of different animals were aligned at the site of maximal response within each shank. Positive distances are dorsal to the maximum. (d) Maximal amplitude of the response evoked at each shank by stimulation (700 μA) of each cortical area in control and DAN-lesioned mice. In DAN-lesioned mice, the responses to prelimbic stimulation were reduced at all shanks and the pattern of responses to cingulate and motor stimulation was degraded (two-way ANOVAs, #P<0.05 treatment main effect; *P<0.05 control vs DAN-lesioned, Tukey's post hoc test after significant treatment per shank interaction). Data are mean±SEM; animal numbers are indicated in parentheses.
Figure 6
Figure 6
Contraction of medium spiny neuron dendritic fields in DAN-lesioned animals. (a) Photomicrograph of representative control direct and indirect pathway MSNs, high-magnification images of dendrites, and examples of reconstructions of the dendritic tree. (b) Striatal section immunostained for TH in representative DAN-depleted mice (aca, anterior commissure; mSt, medial striatum; lSt, lateral striatum; cc, corpus callosum). In DAN-lesioned mice, the percentage of immunoreactive TH area was lower in the mSt compared with the lSt (RM ANOVA, interaction: F1, 27=17.1, P=0.001; *P<0.05 Tukey's comparisons). Grid of MSNs injected with Lucifer yellow (LY) and immunostained with antibodies against the dye (right). (c, d) DAN-depleted mice showed a reduction in total dendritic length in both types of MSN (c: two-way ANOVA, treatment effect: F1, 42=7.4, *P=0.009; MSN type effect: F1, 42=6.0, *P=0.02) without changes in spine density (d: two-way ANOVA). (e) Sholl analysis: dendritic length at different distances from the soma (upper panel) and number of dendritic branches intersecting circular rings drawn around the soma (lower panel). Distal dendritic length was reduced in iMSNs (RM ANOVA, interaction F10, 230=6.1, P<0.001) but not dMSNs (F10, 230=1.5, NS), whereas intersections were reduced in both (RM ANOVA interactions, iMSNs: F10, 230=3.9, P<0.001 dMSNs: F10, 230=2.1, P=0.027). *P<0.05 Tukey's post hoc test after significant interaction). Data are mean±SEM; animal numbers are indicated in parentheses; scale bar: 10 μm (a) and 100 μm (b).

References

    1. Adams GK, Watson KK, Pearson J, Platt ML. Neuroethology of decision-making. Curr Opin Neurobiol. 2012;22:982–989. - PMC - PubMed
    1. Archer T, Danysz W, Fredriksson A, Jonsson G, Luthman J, Sundström E, et al. Neonatal 6-hydroxydopamine-induced dopamine depletions: motor activity and performance in maze learning. Pharmacol Biochem Behav. 1988;31:357–364. - PubMed
    1. Arnsten AFT. Catecholamine influences on dorsolateral prefrontal cortical networks. Biol Psychiatry. 2011;69:e89–e99. - PMC - PubMed
    1. Avale ME, Falzone TL, Gelman DM, Low MJ, Grandy DK, Rubinstein M. The dopamine D4 receptor is essential for hyperactivity and impaired behavioral inhibition in a mouse model of attention deficit/hyperactivity disorder. Mol Psychiatry. 2004;9:718–726. - PubMed
    1. Belforte JE, Zsiros V, Sklar ER, Jiang Z, Yu G, Li Y, et al. Postnatal NMDA receptor ablation in corticolimbic interneurons confers schizophrenia-like phenotypes. Nat Neurosci. 2010;13:76–83. - PMC - PubMed

Publication types

MeSH terms

LinkOut - more resources