

Synergistic innate and adaptive immune response to combination immunotherapy with anti-tumor antigen antibodies and extended serum half-life IL-2
- PMID: 25873172
- PMCID: PMC4398916
- DOI: 10.1016/j.ccell.2015.03.004
Synergistic innate and adaptive immune response to combination immunotherapy with anti-tumor antigen antibodies and extended serum half-life IL-2
Abstract
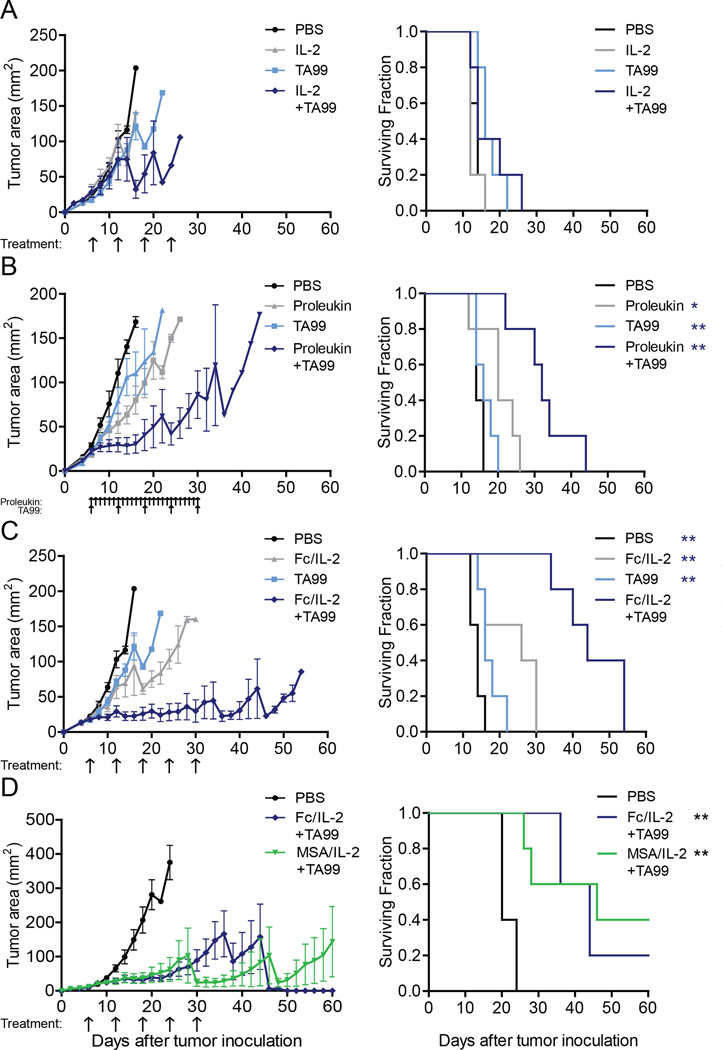
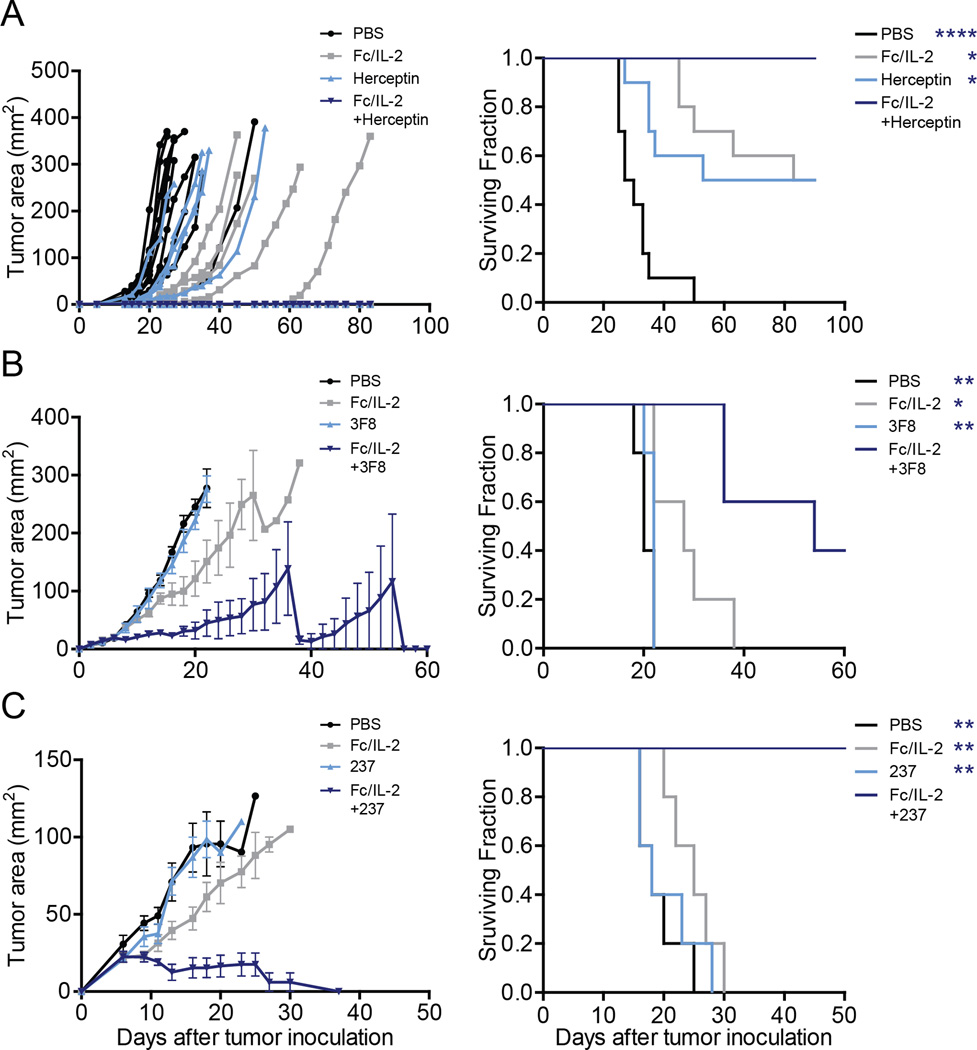
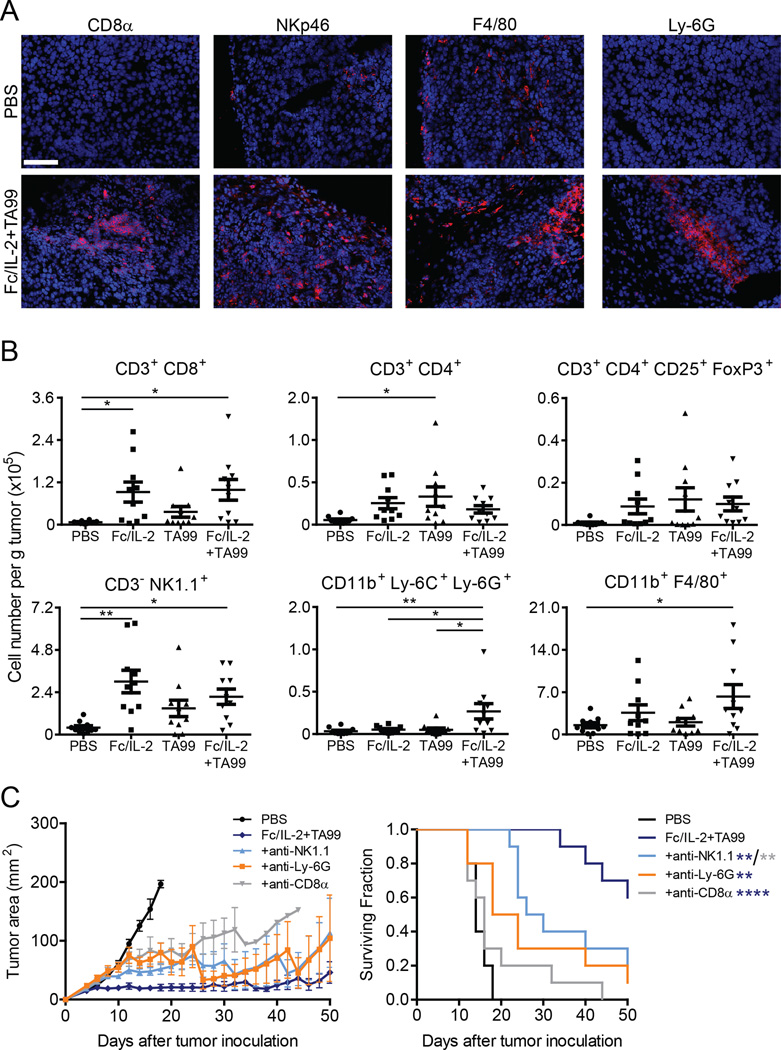
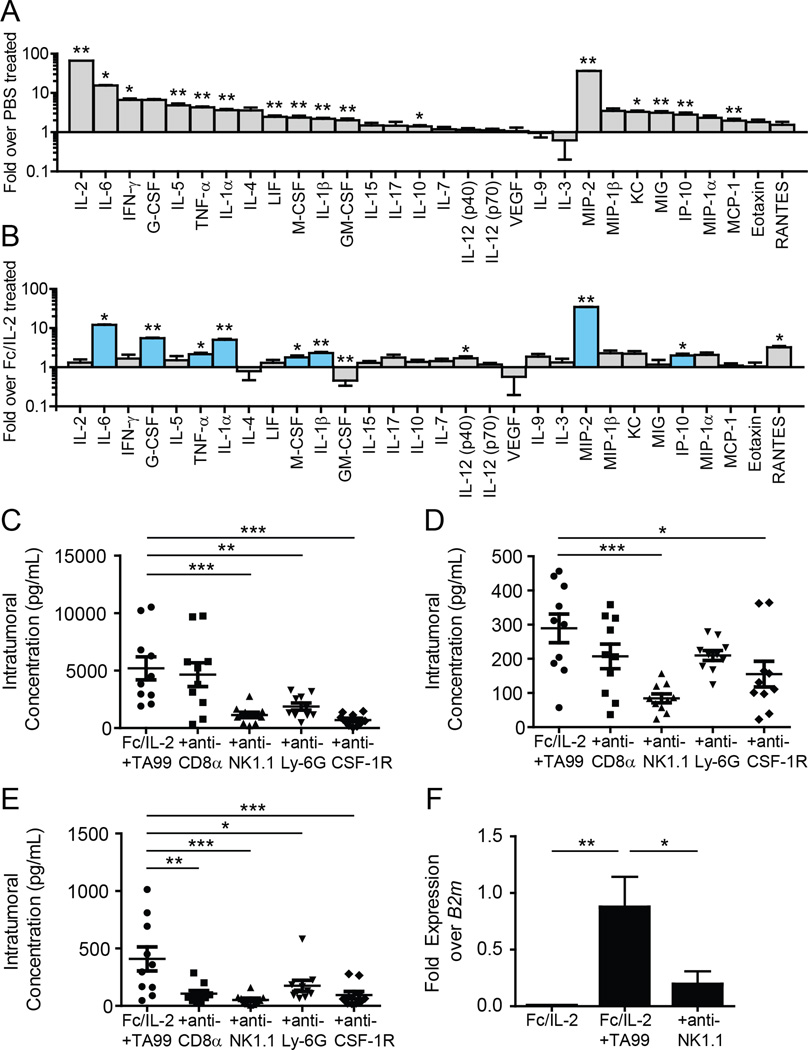
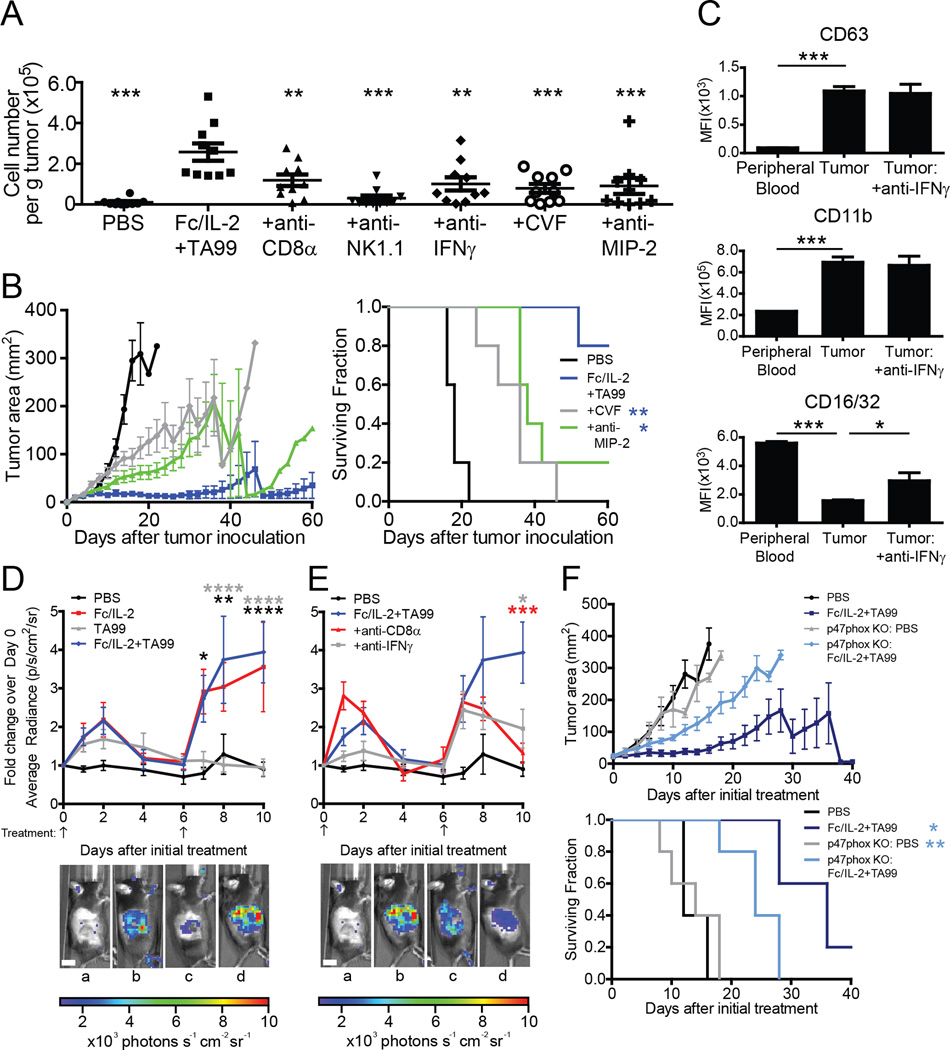
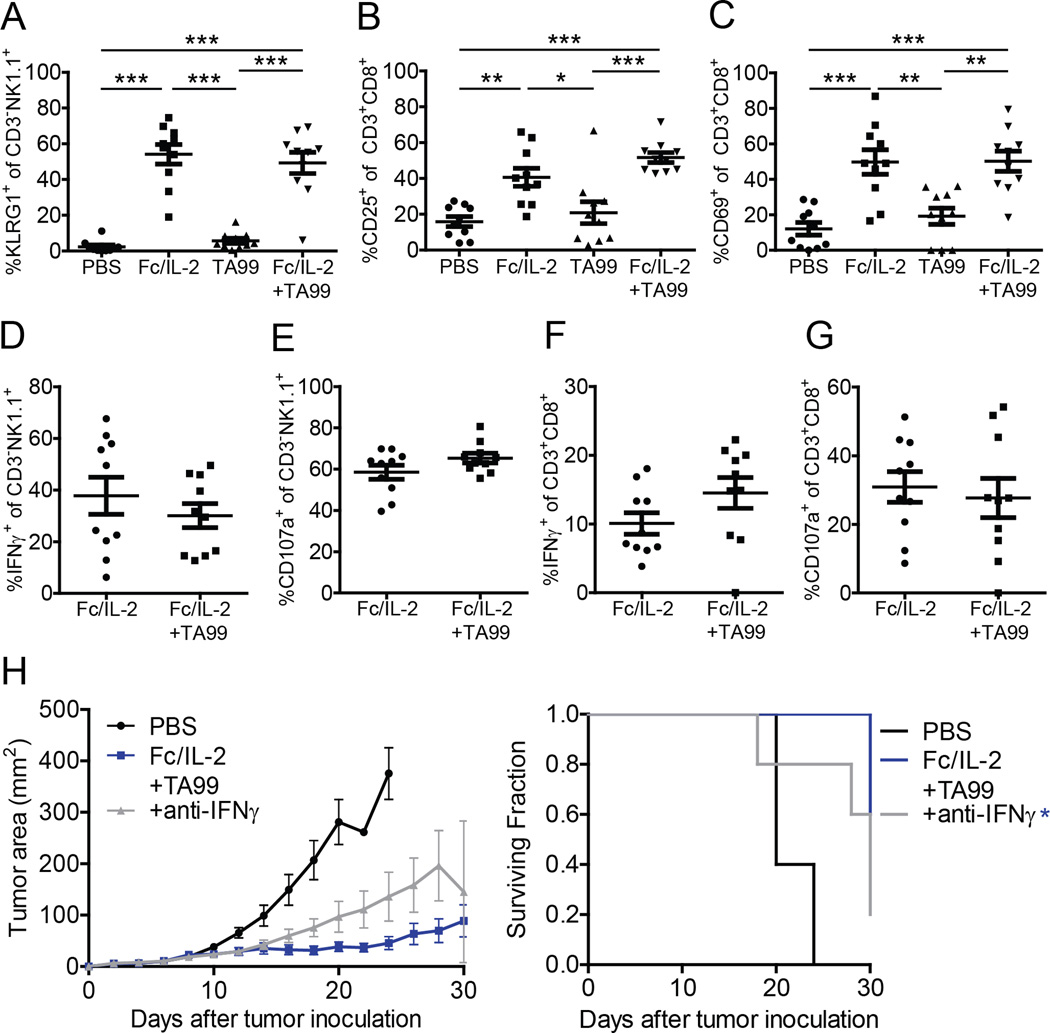
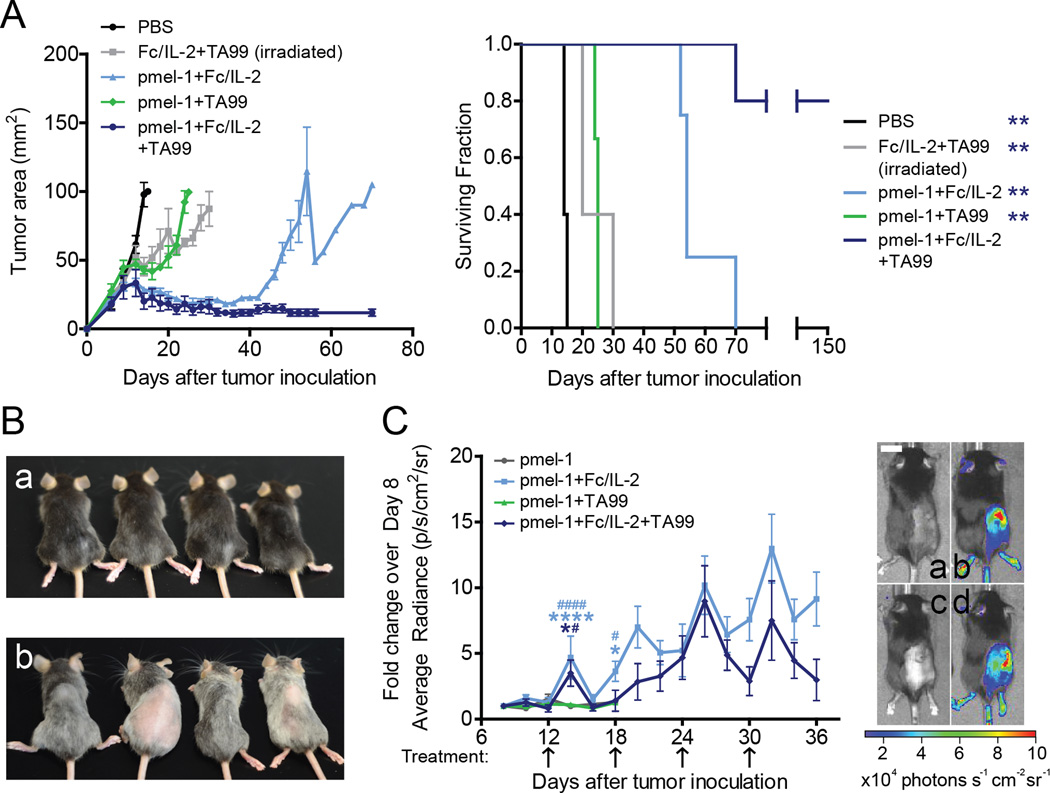
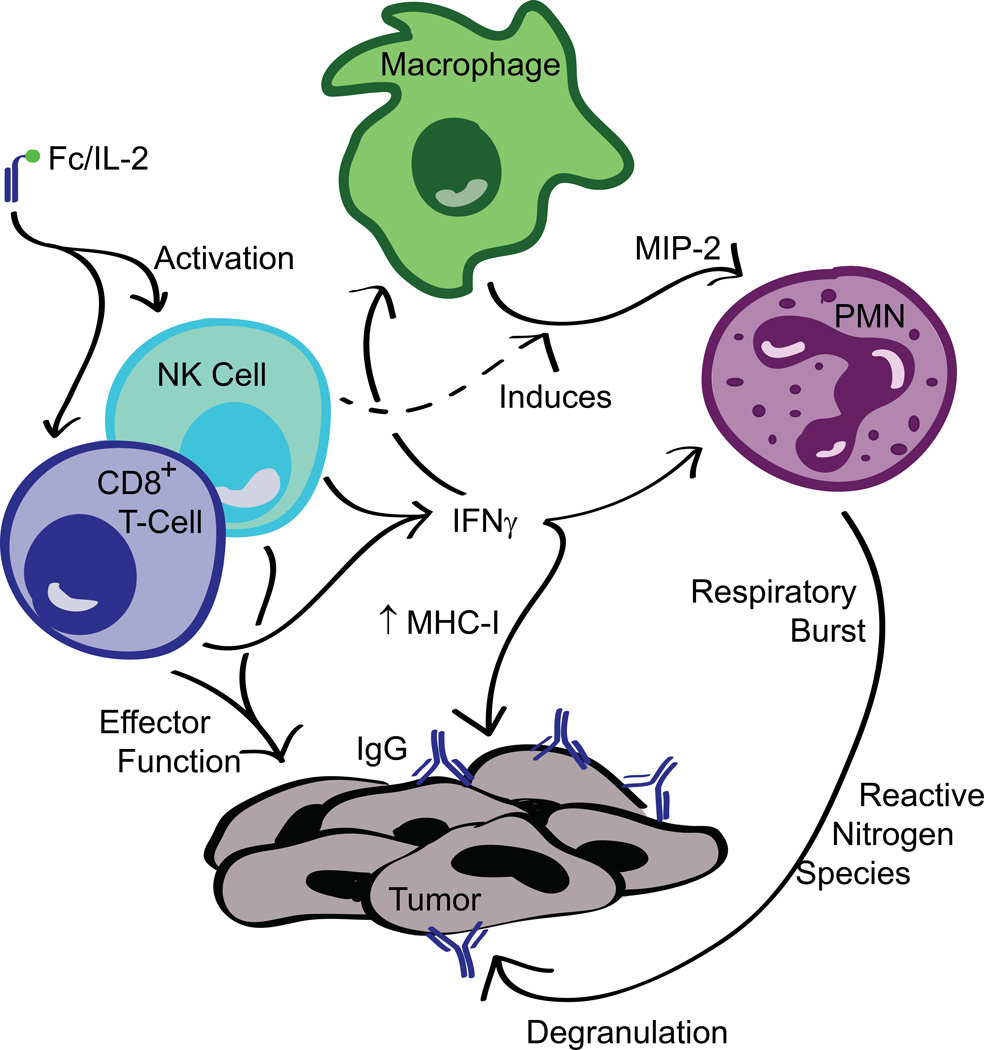
Cancer immunotherapies under development have generally focused on either stimulating T cell immunity or driving antibody-directed effector functions of the innate immune system such as antibody-dependent cell-mediated cytotoxicity (ADCC). We find that a combination of an anti-tumor antigen antibody and an untargeted IL-2 fusion protein with delayed systemic clearance induces significant tumor control in aggressive isogenic tumor models via a concerted innate and adaptive response involving neutrophils, NK cells, macrophages, and CD8(+) T cells. This combination therapy induces an intratumoral "cytokine storm" and extensive lymphocyte infiltration. Adoptive transfer of anti-tumor T cells together with this combination therapy leads to robust cures of established tumors and development of immunological memory.
Copyright © 2015 Elsevier Inc. All rights reserved.
Figures
Similar articles
-
In vivo expansion of activated naive CD8+ T cells and NK cells driven by complexes of IL-2 and anti-IL-2 monoclonal antibody as novel approach of cancer immunotherapy.J Immunol. 2009 Oct 15;183(8):4904-12. doi: 10.4049/jimmunol.0900284. J Immunol. 2009. PMID: 19801515
-
NK and CD8+ T cell-mediated eradication of poorly immunogenic B16-F10 melanoma by the combined action of IL-12 gene therapy and 4-1BB costimulation.Int J Cancer. 2004 Apr 20;109(4):499-506. doi: 10.1002/ijc.11696. Int J Cancer. 2004. PMID: 14991570
-
Requirement for innate immunity and CD90⁺ NK1.1⁻ lymphocytes to treat established melanoma with chemo-immunotherapy.Cancer Immunol Res. 2015 Mar;3(3):296-304. doi: 10.1158/2326-6066.CIR-14-0120. Epub 2015 Jan 19. Cancer Immunol Res. 2015. PMID: 25600438 Free PMC article.
-
Anti-cancer Therapies Employing IL-2 Cytokine Tumor Targeting: Contribution of Innate, Adaptive and Immunosuppressive Cells in the Anti-tumor Efficacy.Front Immunol. 2018 Dec 18;9:2905. doi: 10.3389/fimmu.2018.02905. eCollection 2018. Front Immunol. 2018. PMID: 30619269 Free PMC article. Review.
-
IL-15: targeting CD8+ T cells for immunotherapy.Cytotherapy. 2005;7(1):23-35. doi: 10.1080/14653240510018037. Cytotherapy. 2005. PMID: 16040381 Review.
Cited by
-
Tissue-specific abundance of interferon-gamma drives regulatory T cells to restrain DC1-mediated priming of cytotoxic T cells against lung cancer.Immunity. 2023 Feb 14;56(2):386-405.e10. doi: 10.1016/j.immuni.2023.01.010. Epub 2023 Feb 2. Immunity. 2023. PMID: 36736322 Free PMC article.
-
Targeting the CD47-SIRPα Innate Immune Checkpoint to Potentiate Antibody Therapy in Cancer by Neutrophils.Cancers (Basel). 2022 Jul 11;14(14):3366. doi: 10.3390/cancers14143366. Cancers (Basel). 2022. PMID: 35884427 Free PMC article. Review.
-
Localization of Salmonella and albumin-IL-2 to the tumor microenvironment augments anticancer T cell immunity.J Biomed Sci. 2022 Aug 12;29(1):57. doi: 10.1186/s12929-022-00841-y. J Biomed Sci. 2022. PMID: 35962391 Free PMC article.
-
Antibody-Dependent Cellular Phagocytosis by Macrophages is a Novel Mechanism of Action of Elotuzumab.Mol Cancer Ther. 2018 Jul;17(7):1454-1463. doi: 10.1158/1535-7163.MCT-17-0998. Epub 2018 Apr 13. Mol Cancer Ther. 2018. PMID: 29654064 Free PMC article.
-
A resource of high-quality and versatile nanobodies for drug delivery.iScience. 2021 Aug 21;24(9):103014. doi: 10.1016/j.isci.2021.103014. eCollection 2021 Sep 24. iScience. 2021. PMID: 34522857 Free PMC article.
References
-
- Abès R, Gélizé E, Fridman WH, Teillaud J-L. Long-lasting antitumor protection by anti-CD20 antibody through cellular immune response. Blood. 2010;116:926–934. - PubMed
-
- Allavena P, Sica A, Vecchi A, Locati M, Sozzani S, Mantovani A. The chemokine receptor switch paradigm and dendritic cell migration: its significance in tumor tissues. Immunol. Rev. 2000;177:141–149. - PubMed
-
- Anderson CL, Chaudhury C, Kim J, Bronson CL, Wani MA, Mohanty S. Perspective-- FcRn transports albumin: relevance to immunology and medicine. Trends Immunol. 2006;27:343–348. - PubMed
-
- Bajorin DF, Chapman PB, Wong G, Coit DG, Kunicka J, Dimaggio J, Cordon-cardo C, Urmacher C, Dantes L, Templeton MA, et al. Phase I evaluation of a combination of monoclonal antibody R24 and interleukin 2 in patients with metastatic melanoma. Cancer Res. 1990;50:7490–7495. - PubMed
-
- Baley Pa, Yoshida K, Qian W, Sehgal I, Thompson TC. Progression to androgen insensitivity in a novel in vitro mouse model for prostate cancer. J. Steroid Biochem. Mol. Biol. 1995;52:403–413. - PubMed
Publication types
MeSH terms
Substances
Grants and funding
LinkOut - more resources
Full Text Sources
Other Literature Sources
Molecular Biology Databases
Research Materials
