. 2015 Apr 13;27(4):502-15.
doi: 10.1016/j.ccell.2015.03.009.

Mutational cooperativity linked to combinatorial epigenetic gain of function in acute myeloid leukemia

Affiliations

Mutational cooperativity linked to combinatorial epigenetic gain of function in acute myeloid leukemia

Alan H Shih et al. Cancer Cell. .

Abstract

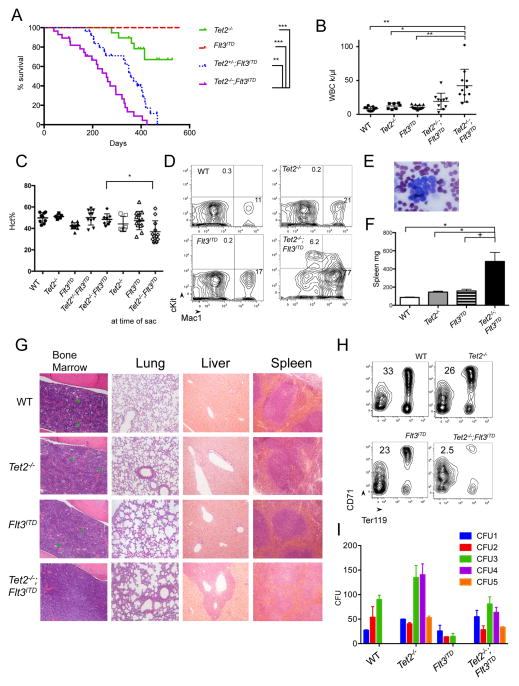
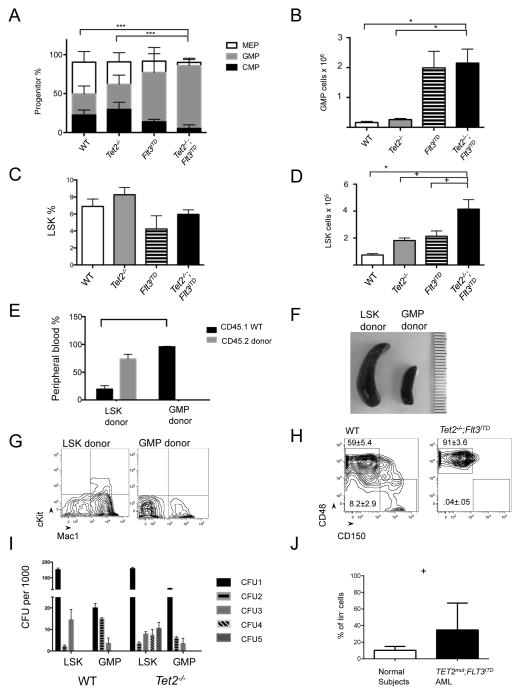
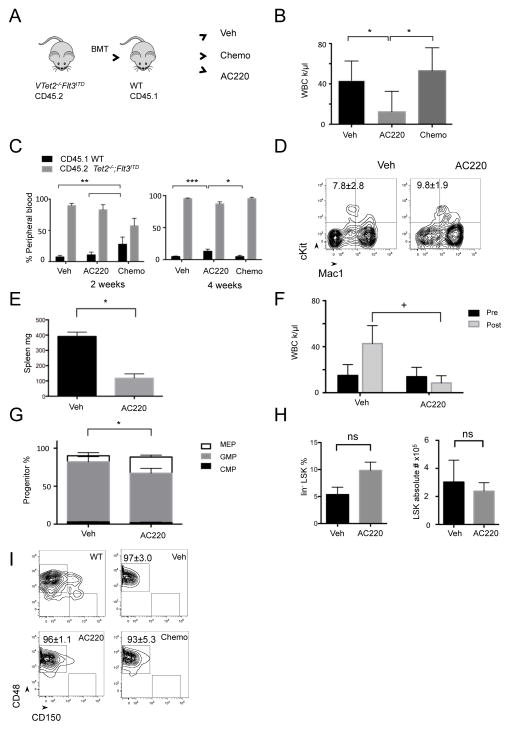
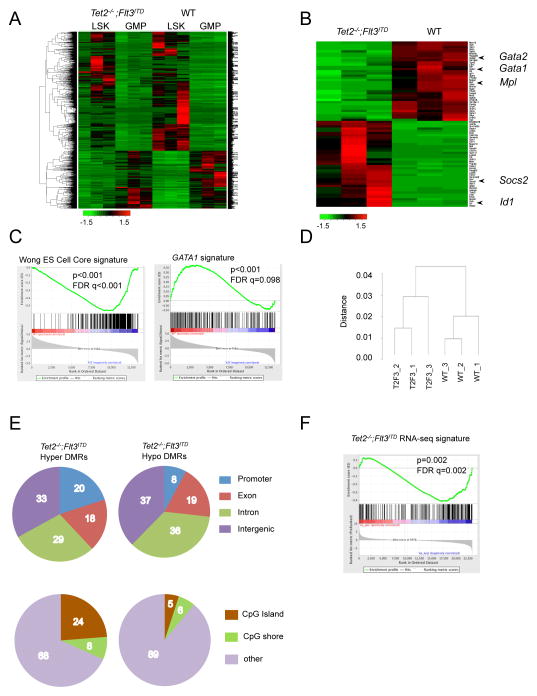
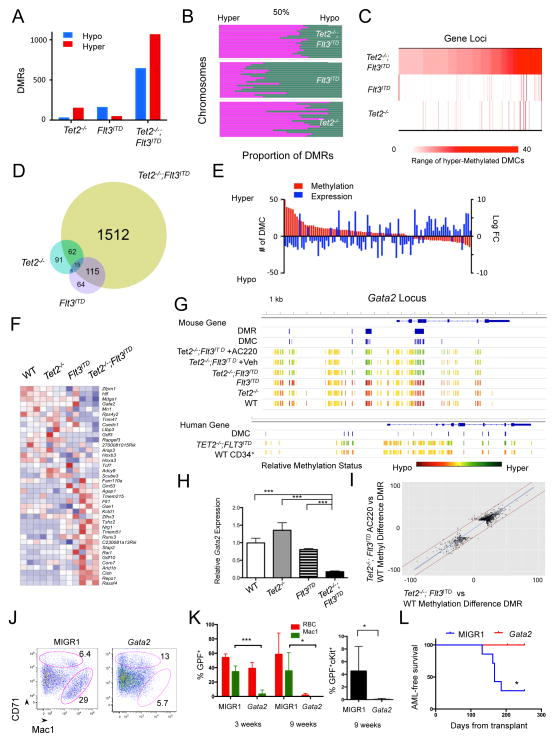
Specific combinations of acute myeloid leukemia (AML) disease alleles, including FLT3 and TET2 mutations, confer distinct biologic features and adverse outcome. We generated mice with mutations in Tet2 and Flt3, which resulted in fully penetrant, lethal AML. Multipotent Tet2(-/-);Flt3(ITD) progenitors (LSK CD48(+)CD150(-)) propagate disease in secondary recipients and were refractory to standard AML chemotherapy and FLT3-targeted therapy. Flt3(ITD) mutations and Tet2 loss cooperatively remodeled DNA methylation and gene expression to an extent not seen with either mutant allele alone, including at the Gata2 locus. Re-expression of Gata2 induced differentiation in AML stem cells and attenuated leukemogenesis. TET2 and FLT3 mutations cooperatively induce AML, with a defined leukemia stem cell population characterized by site-specific changes in DNA methylation and gene expression.


Figures

Figure 1
Figure 1. Development of leukemic disease in VTet2−/−Flt3ITDmice
(A) Kaplan Meir survival curve of Tet2−/− (n=19), Flt3ITD (n=23), Tet2+/−;Flt3ITD (n=26), and Tet2−/−;Flt3ITD (n=28). (B–D) Peripheral WBC count at 4 months (B), hematocrit at 4 months and at time of sacrifice (C), and peripheral blood Mac1 and cKit immunophenotype at 4 months (D), mean Mac1+ and cKit+ (n=5 to 12 per group). (E) Peripheral blood morphology in Tet2−/−;Flt3ITD mice. scale bar 10 μm. (F) Spleen weight at 4 months. (G) Histology of bone marrow, lung, liver and spleen of WT, Tet2−/−, Flt3ITD, Tet2−/−;Flt3ITD mice. Scale bar 100 μm bone marrow, lung, and liver; 200 μm spleen. Green arrowheads indicate megakaryocytes. (H) Bone marrow CD71 and Ter119 immunophenotype, gates mean (n=4 to 6 per genotype). (I) Serial plating in methylcellulose and colony counts (representative experiment of n=3). +p<=.05, *p<=.01, **p<=.001, ***p<=.0001. Survival statistics using long-rank test. Otherwise, p values using unpaired Student’s t-test. Graphs mean±SEM. See also Figure S1.
Figure 2
Figure 2. Stem-progenitor immunophenotype and transplantability of VTet2−/−Flt3ITDmice
(A,B) Relative frequency of CMP, GMP, and MEP progenitors in the linScacKit+ cell fraction (A) and absolute GMP cell number (B) in bone marrow. (C,D) Relative frequency (C) and absolute cell number (D) of LSK cells in lin bone marrow (n=4 to 6). (E–G) Analysis of transplanted mice. Peripheral blood CD45.1 (host-derived marker) and CD45.2 (leukemia-derived marker) immunophenotype (E), representative spleen size (millimeter scale) (F), and representative peripheral blood Mac1 and cKit immunophenotype (G) of CD45.1+ recipient mice transplanted with CD45.2+ Tet2−/−;Flt3ITD LSK or GMP cells (n=4 per group). (H) Flow plot of bone marrow LSK cells for MPP (CD48+CD150) and LT-HSC (CD48CD150+) frequency in WT and VTet2−/−Flt3ITD mice, gate mean±SEM (n=4). (I) Re-plating colony counts of WT and Tet2−/− cells sorted for LSK and GMP populations (representative experiment from 3 replicates). (J) TET2;FLT3ITD mutant human AML and normal subject ST-HSC/MPP frequency (n=9). +p<=.05, *p<=.01, ** p<=.001, ***p<=.0001. p values using unpaired Student’s t-test. Graphs mean±SEM. See also Figure S2.
Figure 3
Figure 3. Response of VTet2−/−Flt3ITD leukemia to AC220 and chemotherapy
(A) Treatment scheme with secondary transplanted CD45.2+ Tet2−/−;Flt3ITD bone marrow into CD45.1+ mice (n=5 per group). (B–D) Peripheral blood WBC count after treatment for 4 weeks (B), CD45.1 (host-derived marker) and CD45.2 (leukemia-derived marker) immunophenotype at 2 weeks and 4 weeks (C), and Mac1 and cKit immunophenotype at 4 weeks (D) of vehicle, chemotherapy treated, and AC220 treated mice. (E,F) Spleen size (E) and peripheral blood WBC count (F) of VTet2−/−Flt3ITD mice treated with AC220 for 4 weeks (n=3 per group). (G–I) Bone marrow myeloid progenitor analysis (G), LSK percentage and absolute number (H), and SLAM LSK immunophenotype analysis, gates indicated for MPPs (CD48+CD150) and LT-HSC (CD48CD150+) fractions (I) following vehicle, chemotherapy, or AC220 treatment. +p<=.05, *p<=.01, **p<=.001, ***p<=.0001. p values using unpaired Student’s t-test. Graphs and flow plot numbers, mean±SEM. See also Figure S3.
Figure 4
Figure 4. RNA-seq and methylation analysis of VTet2−/−Flt3ITD mice
(A,B) Heat map from RNA sequencing expression analysis of WT and Tet2−/−;Flt3ITD bone marrow LSK and GMP cells (A) and LSK cells for genes ranked by Fold Change >3.5 and FDR<10−5 (B). z-score scale. (C) GSEA enrichment plot of Tet2−/−;Flt3ITD LSK RNA expression correlated with the embryonic stem cell signature and negatively correlated with GATA1 signature. (D) Dendrogram clustering based on eRRBS methylation profiles from WT and Tet2−/−;Flt3ITD (T2F3) LSK cells. (E) Gene localization of hypermethylated and hypomethylated differentially methylated regions (DMRs) in Tet2−/−;Flt3ITD LSK cells, percentages. (F) GSEA enrichment plot correlating hypermethylation promoter genes with genes with down-regulated expression trend in Tet2−/−;Flt3ITD LSK cells. See also Figure S4, Table S1–3.
Figure 5
Figure 5. Flt3ITD mutation and Tet2 loss synergistically regulate gene expression
(A,B) Number of differentially methylated regions (DMRs) (A) and chromosomal hypermethylation and hypomethylation proportions (B) in Tet2−/−, Flt3ITD, Tet2−/−;Flt3ITD LSKs. (C) Heat map of number of hypermethylated differentially methylated cytosines (DMCs) in 424 genes in Tet2−/−;Flt3ITD LSKs compared to number of DMCs in Tet2−/− and Flt3ITD LSKs. (D) Venn diagram of genes associated with DMRs for each genotype. (E) Bar graph of paired DMC number (in red) and expression change (in blue) for genes with promoter and intron DMCs and differential RNA expression. (F) Heat map of RNA expression based on genes in Table 1 (>=6 DMCs and altered expression in Tet2−/−;Flt3ITD LSKs) for LSKs of each genotype. z-score scale. (G) Gata2 locus methylation for LSK cells, LSK cells following treatment, and human ST-HSC leukemia and CD34+ cell populations (scaled to average methylation). Also, location of DMRs and DMCs as determined through eRRBS analysis. (H) Gata2 relative RNA expression in LSK cells. (I) Scatter plot of corresponding DMRs between Tet2−/−;Flt3ITD LSKs and Tet2−/−;Flt3ITD AC220 treated LSKs. Fitted line in blue; +/− 20% variation between samples by red lines. (PearsonCorr=0.948) (J) CD71 and Mac1 immunophenotype of methylcellulose colonies from Tet2−/−;Flt3ITD cells expressing MIGR1 control or Gata2, mean gate frequency. (K,L) Peripheral blood GFP% of red blood cells (RBC), Mac1+ cells, and cKit+ cells at 3 weeks and 9 weeks (K) and leukemia free survival (L) of mice transplanted with MIGR1 (n=7) and Gata2 (n=5) transduced Tet2−/−;Flt3ITD bone marrow. *p<=.01, ***p<.0001, using unpaired Student’s t-test. Graphs mean±SEM. Survival statistic by long-rank test. See also Figure S5, Table S4 – S7.

References

    1. Abdel-Wahab O, Mullally A, Hedvat C, Garcia-Manero G, Patel J, Wadleigh M, Malinge S, Yao J, Kilpivaara O, Bhat R, et al. Genetic characterization of TET1, TET2, and TET3 alterations in myeloid malignancies. Blood. 2009;114:144–147. - PMC - PubMed
    1. Akalin A, Garrett-Bakelman FE, Kormaksson M, Busuttil J, Zhang L, Khrebtukova I, Milne TA, Huang Y, Biswas D, Hess JL, et al. Base-pair resolution DNA methylation sequencing reveals profoundly divergent epigenetic landscapes in acute myeloid leukemia. PLoS Genet. 2012a;8:e1002781. - PMC - PubMed
    1. Akalin A, Kormaksson M, Li S, Garrett-Bakelman FE, Figueroa ME, Melnick A, Mason CE. methylKit: a comprehensive R package for the analysis of genome-wide DNA methylation profiles. Genome Biol. 2012b;13:R87. - PMC - PubMed
    1. Barreyro L, Will B, Bartholdy B, Zhou L, Todorova TI, Stanley RF, Ben-Neriah S, Montagna C, Parekh S, Pellagatti A, et al. Overexpression of IL-1 receptor accessory protein in stem and progenitor cells and outcome correlation in AML and MDS. Blood. 2012;120:1290–1298. - PMC - PubMed
    1. Bejar R, Lord A, Stevenson K, Bar-Natan M, Perez-Ladaga A, Zaneveld J, Wang H, Caughey B, Stojanov P, Getz G, et al. TET2 mutations predict response to hypomethylating agents in myelodysplastic syndrome patients. Blood. 2014;124:2705–2712. - PMC - PubMed

Publication types

MeSH terms