. 2015 Apr 13;27(4):533-46.
doi: 10.1016/j.ccell.2015.03.010.

AXL mediates resistance to PI3Kα inhibition by activating the EGFR/PKC/mTOR axis in head and neck and esophageal squamous cell carcinomas

Affiliations

AXL mediates resistance to PI3Kα inhibition by activating the EGFR/PKC/mTOR axis in head and neck and esophageal squamous cell carcinomas

Moshe Elkabets et al. Cancer Cell. .

Abstract

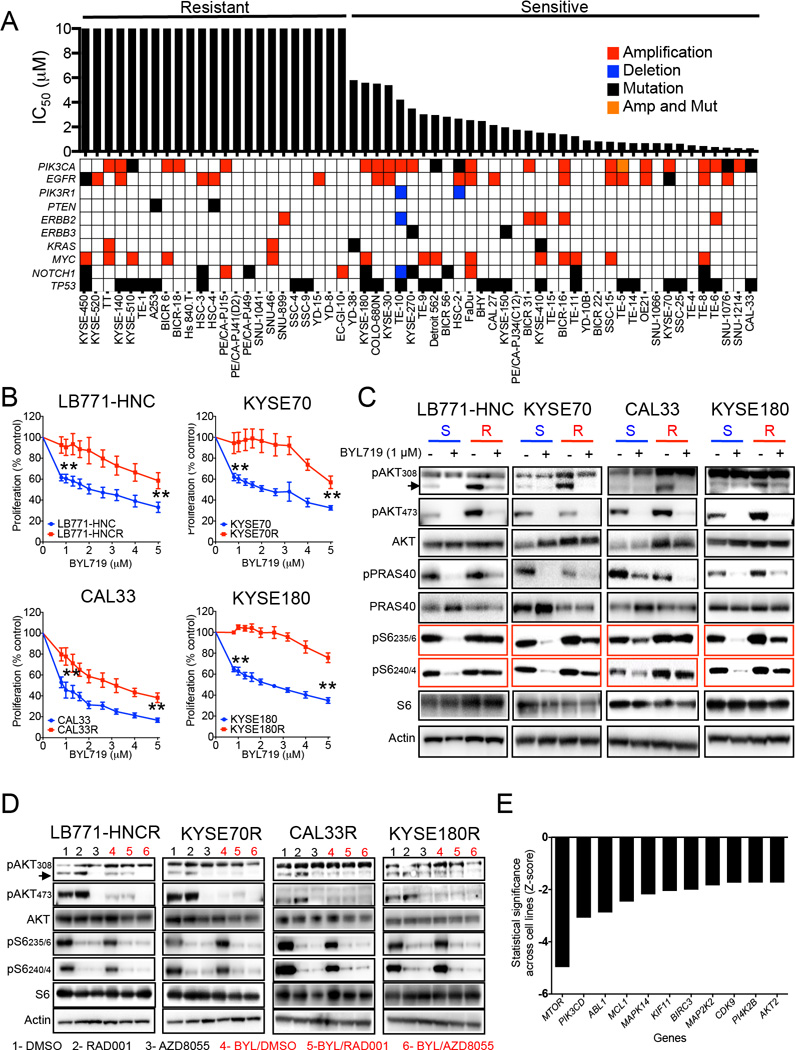
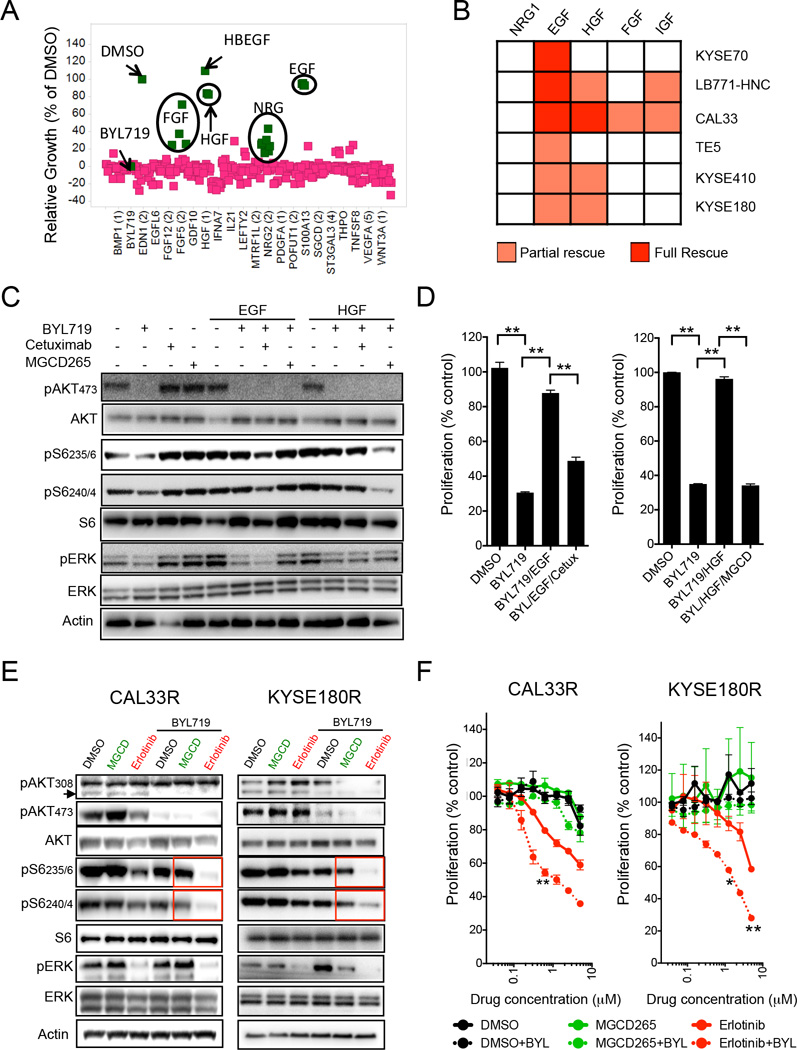
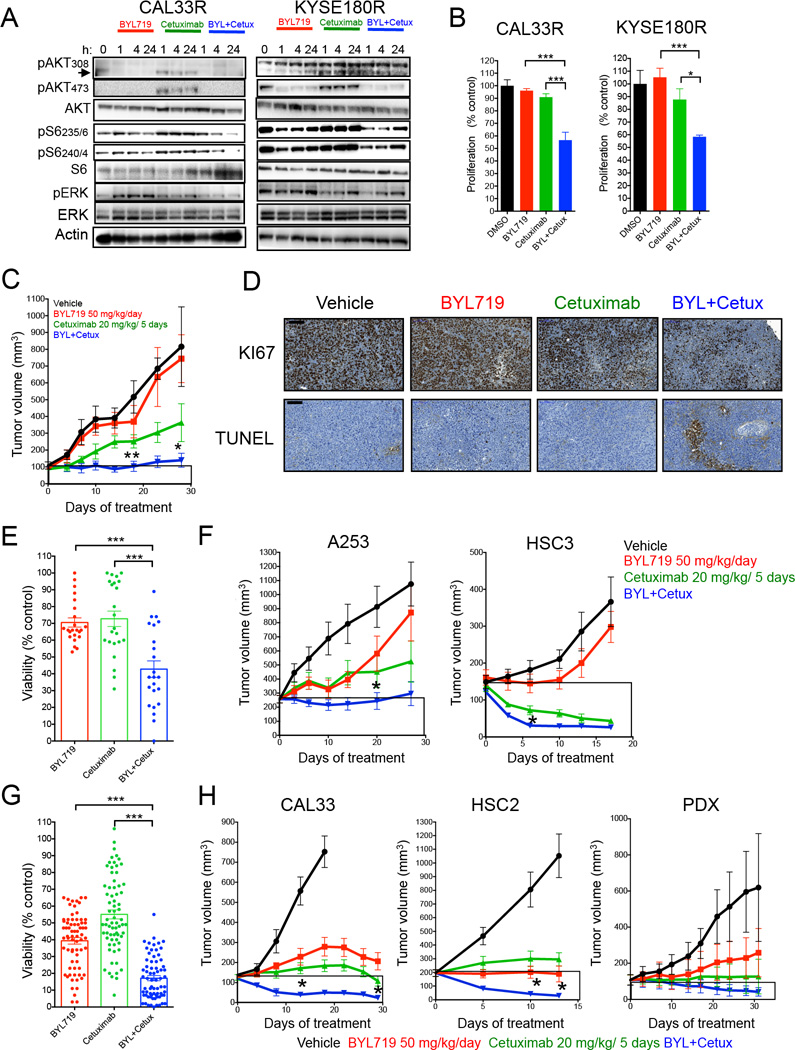
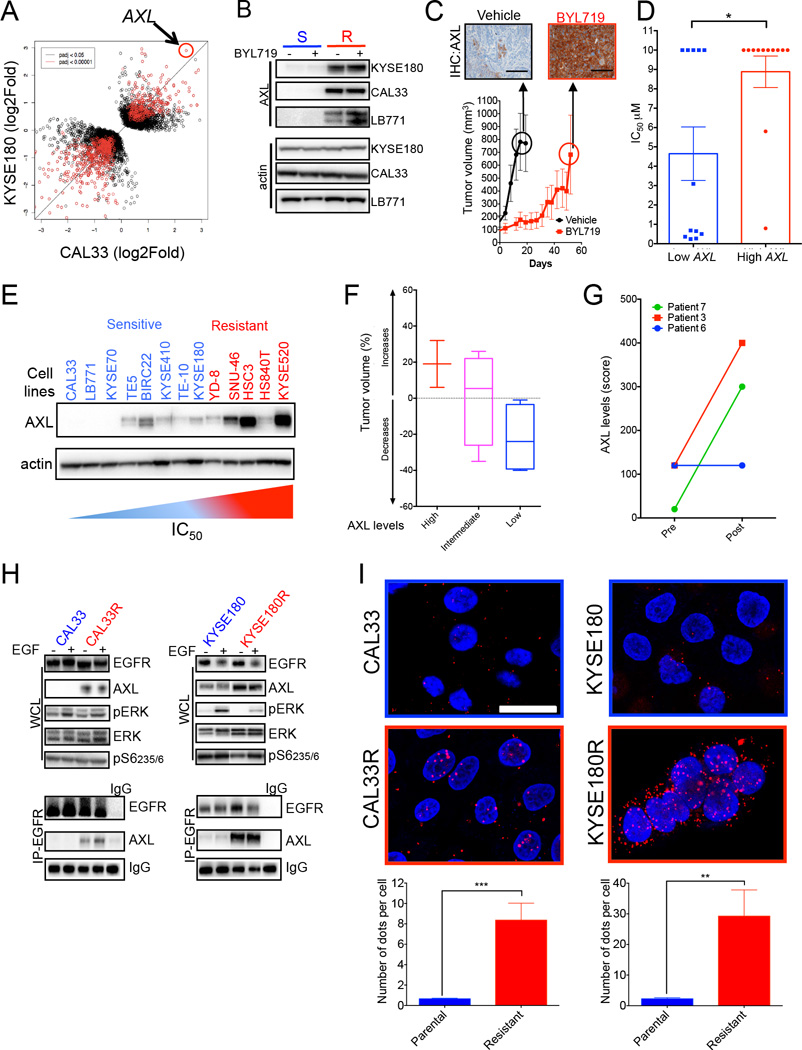
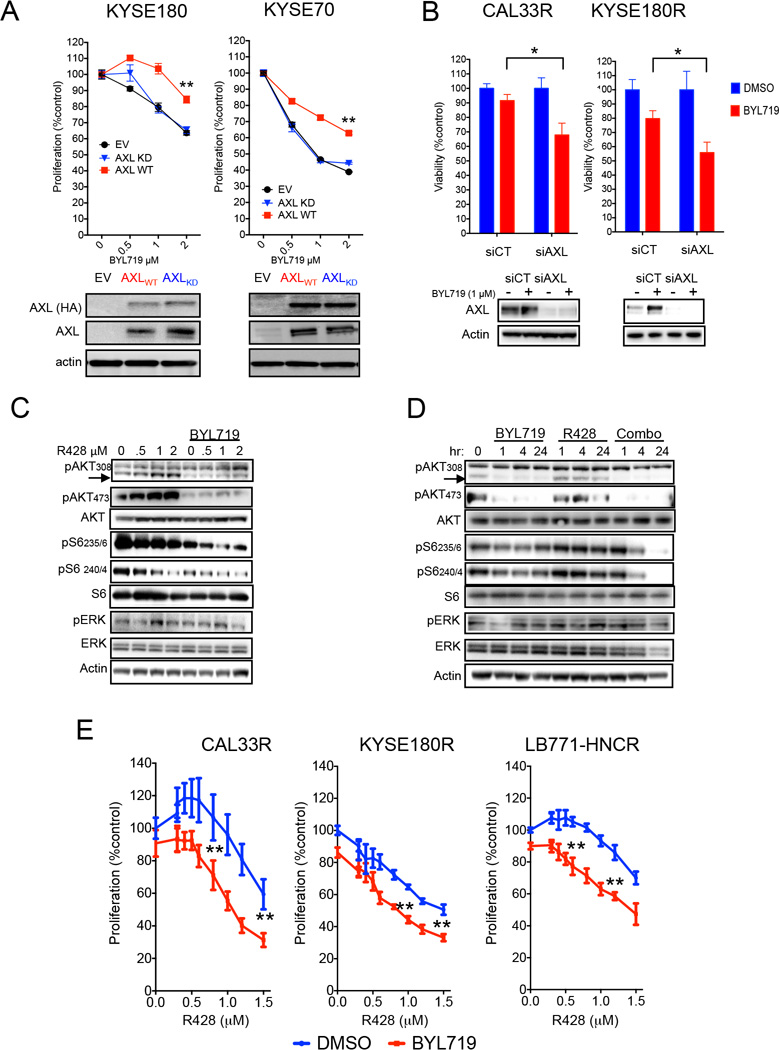
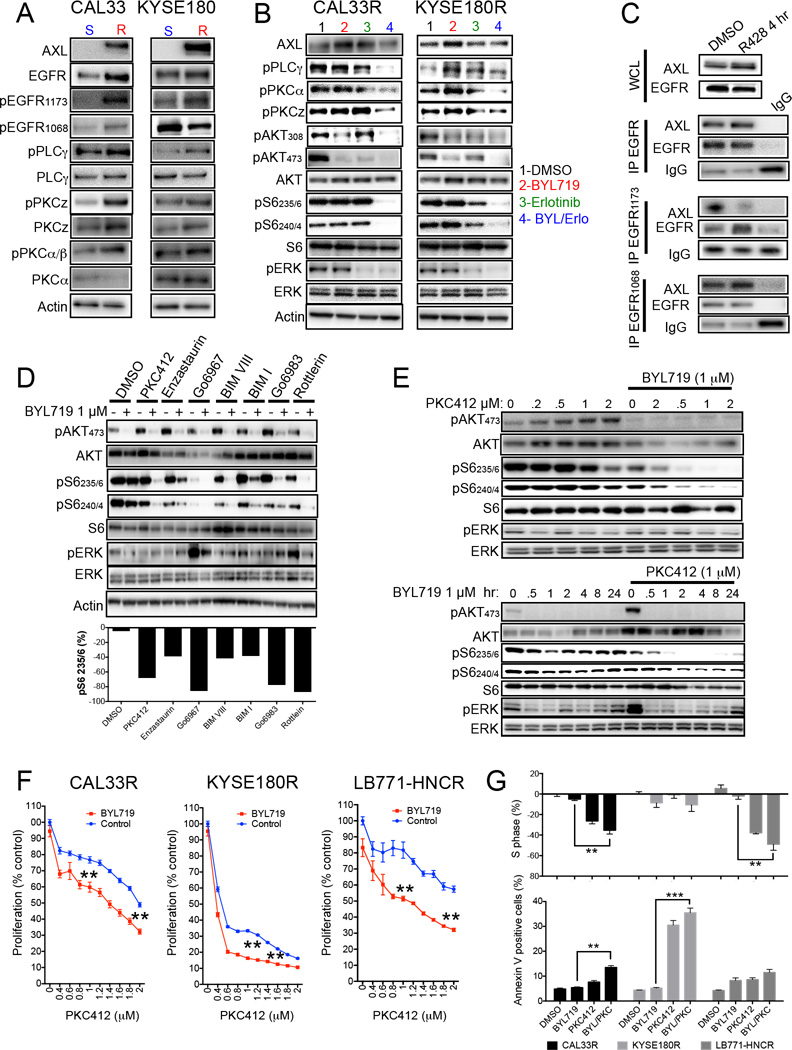
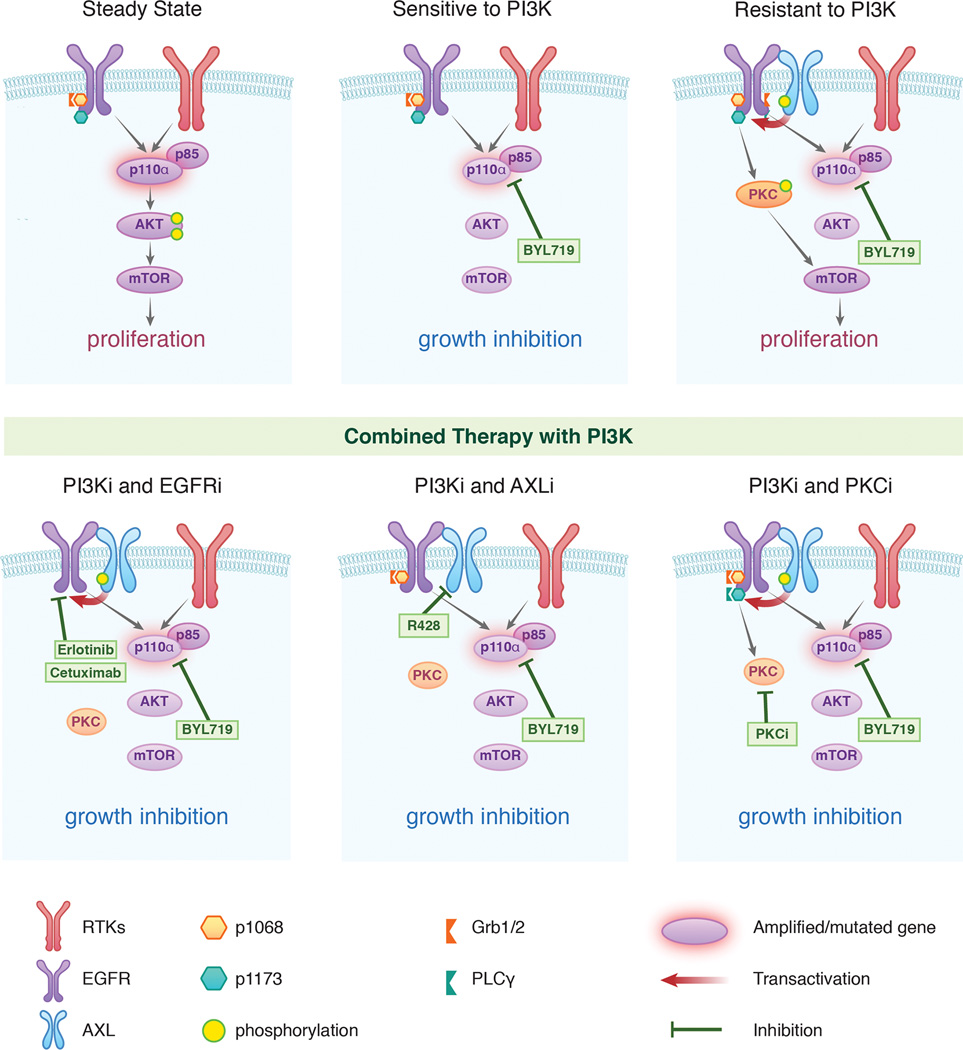
Phosphoinositide-3-kinase (PI3K)-α inhibitors have shown clinical activity in squamous cell carcinomas (SCCs) of head and neck (H&N) bearing PIK3CA mutations or amplification. Studying models of therapeutic resistance, we have observed that SCC cells that become refractory to PI3Kα inhibition maintain PI3K-independent activation of the mammalian target of rapamycin (mTOR). This persistent mTOR activation is mediated by the tyrosine kinase receptor AXL. AXL is overexpressed in resistant tumors from both laboratory models and patients treated with the PI3Kα inhibitor BYL719. AXL dimerizes with and phosphorylates epidermal growth factor receptor (EGFR), resulting in activation of phospholipase Cγ (PLCγ)-protein kinase C (PKC), which, in turn, activates mTOR. Combined treatment with PI3Kα and either EGFR, AXL, or PKC inhibitors reverts this resistance.


Conflict of interest statement

Conflict of interest

J.B., D.J. and N.R. have consulted for Novartis Pharmaceuticals. A.H., Q.S., J.J.Y., R.D., Y.C., A.T., H.W., J.L., and M.L. are full-time employees of Novartis Pharmaceuticals.

Figures

Figure 1
Figure 1. PI3K/AKT-independent mTOR activation in BYL719-resistant cells
(A) Main genetic features and IC50 for BYL719 of 58 cell lines from H&N and esophageal SCC. (B) Proliferation (5 days) of four cell lines sensitive to BYL719 in comparison with their resistant counterparts upon increasing doses of BYL719. (C) Western blot analysis of PI3K/AKT pathway signaling using cell lysates from BYL719-sensitive (S) and resistant (R) cells treated with 1 µM BYL719 for 4 hr and the indicated antibodies. (D) Western blot with the indicated antibodies of protein lysates from BYL719-resistant cells upon 4 hr of treatment with 100 nM RAD001 or 500 nM AZD8055 with and without 1 µM BYL719. (E) Ranking of knock-down genes which re-sensitizes resistant cells to BYL719 (Z-score). Data are presented as means ± SEM. p values were calculated using two-sided Student's t test. **p<0.01. See also Figure S1 and Table S1.
Figure 2
Figure 2. Role of EGFR in maintaining mTOR activity upon BYL719 treatment
(A) Results from a secretome screen conducted in CAL33 cells upon treatment for 4 days with 1 µM BYL719. Each square represents the average of three replicates of cells conditioned with the same ligand. Y axis show relative cell growth as a % of DMSO. (B) Heatmap showing the effects of recombinant ligands in limiting the antiproliferative activity of 1 µM of BYL719 for six days in H&N and esophageal SCC cell lines. Red and orange indicate full and partial rescue from treatment, respectively. (C) Western blot with the indicated antibodies of CAL33 cell line treated for 4 hr with 1 µM BYL719, 10 µg/ml cetuximab and 1 µM MGCD265 in the presence of 50 ng/ml of EGF or HGF as indicated. (D) Proliferation (6 days) of CAL33 cells treated as indicated with 1 µM BYL719, 10 µg/ml cetuximab and 1 µM MGCD265 in the presence of 50 ng/ml of EGF or HGF. (E) Western blot with the indicated antibodies of protein lysates from CAL33R and KYSE180R cells treated with 1 µM BYL719 in combination with either 1 µM MGCD265 or 5 µM erlotinib. (F) Proliferation (5 days) of resistant cell lines treated with different concentrations of erlotinib or MGCD265 with or without 1 µM BYL719. Significance of erlotinib+BYL versus erlotinib is displayed. Data are presented as means ± SEM. p values were calculated using two-sided Student's t test. *p<0.05, **p<0.01. See also Figure S2 and Table S2.
Figure 3
Figure 3. Antitumor activity of BYL719 in combination with cetuximab
(A) Western blot with the indicated antibodies of protein lysates from resistant cells treated as indicated with 1 µM BYL719, 5 µg/ml cetuximab or the combination. (B) Proliferation (6 days) of resistant cells treated with 1 µM BYL719, 5 µg/ml cetuximab and the combination. (C) Tumor growth of KYSE180R-derived xenografts treated as indicated (n= 6–10 per arm). Significance of combination versus cetuximab is displayed. (D) KYSE180R derived xenografts tumors from mice treated as indicated were analyzed for proliferation (Ki67) and apoptosis (TUNEL). (E) Cell viability (4 days) of 23 cell lines intrinsically resistant to BYL719 treated with 3 µM BYL719, 10 ng/ml cetuximab or the combination. (F) Tumor growth of A253- and HSC3-derived xenografts (intrinsically resistant to BYL719) treated as indicated (n= 6–10 per arm). Significance of combination versus cetuximab is displayed. (G) Cell viability (4 days) of 35 cell lines intrinsically sensitive to BYL719 treated with 3 µM BYL719, 10 ng/ml cetuximab or the combination. (H) Tumor growth of xenograft derived from BYL719-sensitive cell lines treated as indicated (n= 6–10 per arm). For CAL33 significance of combination versus cetuximab is displayed. For HSC2 significance of combination versus BYL719 is displayed. Data are presented as means ± SEM. p value was calculated using two-sided Student’s t test. *p<0.05, **p<0.01, ***p<0.005. Scale bar = 100 µm. See also Figure S3 and Table S3.
Figure 4
Figure 4. Up-regulation of AXL in BYL719 resistant tumors, and direct interaction with EGFR
(A) Dot plot analysis from RNA sequencing of KYSE180 and CAL33 cells compared to their resistant counterparts. (B) AXL levels in the indicated sensitive (S) and resistant (R) cell lines treated with 1 µM BYL719. (C) Tumor growth of KYSE180-derived xenografts treated with 50 mg/Kg BYL719 daily. AXL levels in control tumors (vehicle) and in xenografts after treatment with BYL719 for 2 months are shown. Scale bar: 100 µm. (D) Comparison of IC50 between SCC cells with high and low (1st Vs 4th quartile) AXL mRNA expression (data extracted from the TCGA). (E) Baseline AXL expression on a panel of BYL719-sensitive and resistant cell lines. (F) Box plot representation of tumor volume as a function of AXL levels quantified in patient tissue samples by immunohistochemistry. Axl levels are split into three groups from high expressing on the left to low expressing on the right. For each group the tumor volume distribution is represented by its statistics, the median as the middle line, the inter quartile range (25%-75%) as the box and the minimum and maximum as the whisker. (G) Changes in AXL levels following BYL719 treatment in three SCC patients. Pre = pre-treatment samples; Post = samples collected at disease progression upon BYL719 therapy. (H) Western blot with the indicated antibodies of whole cell lysates (WCL) or proteins immunoprecipitated with an anti-EGFR antibody (IP) from the indicated cell lines. EGF (50ng/ml) was supplemented to the culture media 20 minutes prior to lysate collection. (I) Proximity ligation assay (PLA) of AXL and EGFR on parental and resistant cells. Quantification of AXL/EGFR complex was carried out using Image J. Scale bar = 25 µn. Data are presented as means ± SEM. p value was calculated using two-sided Student's t test. *p<0.05, **p<0.01, ***p<0.005. See also Figure S4 and Table S4.
Figure 5
Figure 5. AXL/EGFR derives mTOR activation and cause resistance to BYL719
(A) Cell viability of CAL33 and KYSE70 cells overexpressing either wild type (WT) or kinase dead (KD) AXL upon treatment with BYL719 (upper panel) and western blot showing both endogenous and exogenous expression of AXL (lower panel). (B) Cell viability (3 days) of KYSE180R and CAL33R cells subjected to AXL knock-down and treated as indicated (upper panel) and western blot showing AXL knockdown (lower panel). (C) Western blot with the indicated antibodies of cell lysates from KYSE180R cells treated for 4 hr with different concentration of R428 and 1 uM of BYL719. (D) Western blot with the indicated antibodies of cell lysates from KYSE180R treated with 1 µM BYL719, 1 µM R428 or the combination at different time points. (E) Cell viability (4 days) of cells with acquired resistance to BYL719 treated with increased concentrations of R428 with or without 1 µM of BYL719. Data are presented as means ± SEM. p value was calculated using two-sided Student's t test. *p<0.05, **p<0.01. Scale bar = 100 µm. See also Figure S5 and Table S5 and S6.
Figure 6
Figure 6. AXL/EGFR complexes activate mTOR via PLCγ-PKC signaling
(A) Western blot with the indicated antibodies of protein lysates from the indicated cell lines. S: BYL719-sensitive; R: BYL719-resistant. (B) Western blot with the indicated antibodies of protein lysates from CAL33R and KYSE180R cells treated for 4 hr with 5 µM of erlotinib, with or without 1 µM BYL719. (C) Immunoprecipitation (IP) of EGFR1173 and western blot with the indicated antibodies of CAL33R treated for 4 hr with 1 µM R428. WCL: whole cell lysates. IgG: unrelated antibody. (D) Western blot with the indicated antibodies of protein lysates from KYSE180R cells treated for 4 hr with different PKC inhibitors (0.5 µM PKC412, 1 µM Enzastaurin, 10 µM Go6967, 10 µM BIMVIII, 2 µM BIMI, 10 µM Go6983 and 5 µM Rottlerin) with or without 1 µM BYL719. (E) Western blot with the indicated antibodies of protein lysates from KYSE180R cells treated with PKC412 and BYL719 as indicated. (F) Cell viability (4 days) of the indicated cell lines in the presence of 1 µM BYL719 and different concentrations of PKC412. (G) Analysis of cell cycle (S-phase arrest) and cell survival (annexin V) in BYL719-resistant cells after 48 hr of treatment with 1 µM BYL719, 0.5 µM PKC412 or their combination. Means of two independent experiments performed in duplicate per cell line are shown. Data are presented as means ± SEM. p value was calculated using two-sided Student’s t test. **p<0.01. See also Figure S6.
Figure 7
Figure 7. Scheme summarizing the proposed mechanism by which AXL drives resistance to PI3Kα in SCC
Up regulation of AXL and its interaction with EGFR leads to PLCγ-PKC activation via phosphorylation of EGFR on tyrosine1173. This results in sustained mTOR activity upon PI3Kα suppression. Combination of PI3Kα inhibition with EGFR, AXL or PKC suppression would prevent this occurrence by blocking the PLCγ/PKC axis resulting in superior antitumor activity compared as monotherapy.

Similar articles

Cited by

References

    1. Agrawal N, Frederick MJ, Pickering CR, Bettegowda C, Chang K, Li RJ, Fakhry C, Xie TX, Zhang J, Wang J, et al. Exome sequencing of head and neck squamous cell carcinoma reveals inactivating mutations in NOTCH1. Science. 2011;333:1154–1157. - PMC - PubMed
    1. Akagi I, Miyashita M, Makino H, Nomura T, Hagiwara N, Takahashi K, Cho K, Mishima T, Ishibashi O, Ushijima T, et al. Overexpression of PIK3CA is associated with lymph node metastasis in esophageal squamous cell carcinoma. Int J Oncol. 2009;34:767–775. - PubMed
    1. Baselga J, Trigo JM, Bourhis J, Tortochaux J, Cortes-Funes H, Hitt R, Gascon P, Amellal N, Harstrick A, Eckardt A. Phase II multicenter study of the antiepidermal growth factor receptor monoclonal antibody cetuximab in combination with platinum-based chemotherapy in patients with platinum-refractory metastatic and/or recurrent squamous cell carcinoma of the head and neck. J Clin Oncol. 2005;23:5568–5577. - PubMed
    1. Bonner JA, Harari PM, Giralt J, Azarnia N, Shin DM, Cohen RB, Jones CU, Sur R, Raben D, Jassem J, et al. Radiotherapy plus cetuximab for squamous-cell carcinoma of the head and neck. N Engl J Med. 2006;354:567–578. - PubMed
    1. Brand TM, Iida M, Stein AP, Corrigan KL, Braverman CM, Luthar N, Toulany M, Gill PS, Salgia R, Kimple RJ, Wheeler DL. AXL mediates resistance to cetuximab therapy. Cancer Res. 2014a;74:5152–5164. - PMC - PubMed

MeSH terms

Associated data