

Effect of Cinacalcet and Vitamin D Analogs on Fibroblast Growth Factor-23 during the Treatment of Secondary Hyperparathyroidism
- PMID: 25873267
- PMCID: PMC4455198
- DOI: 10.2215/CJN.03270314
Effect of Cinacalcet and Vitamin D Analogs on Fibroblast Growth Factor-23 during the Treatment of Secondary Hyperparathyroidism
Abstract
Background and objectives: Cinacalcet and vitamin D are often combined to treat secondary hyperparathyroidism (SHPT) in patients on dialysis. Independent effects on fibroblast growth factor-23 (FGF-23) concentrations in patients on hemodialysis administered cinacalcet or vitamin D analogs as monotherapies during treatment of SHPT are evaluated.
Design, setting, participants, & measurements: A multicenter, randomized, open-label study to compare the efficacy of cinacalcet versus traditional vitamin D therapy for management of secondary hyperparathyroidism among subjects undergoing hemodialysis (PARADIGM) was a prospective, phase 4, multicenter, randomized, open-label study conducted globally. Participants (n=312) were randomized 1:1 to cinacalcet (n=155) or vitamin D analog (n=157) for 52 weeks. Levels of FGF-23 were measured at baseline and weeks 20 and 52. The absolute and percentage changes from baseline in plasma FGF-23, parathyroid hormone (PTH), calcium (Ca), phosphorus (P), and calcium-phosphorus product (Ca×P) were assessed. Correlations and logistic regression were used to explore relationships between changes in FGF-23 and changes in PTH, Ca, P, and Ca×P from baseline to week 52 by treatment arm.
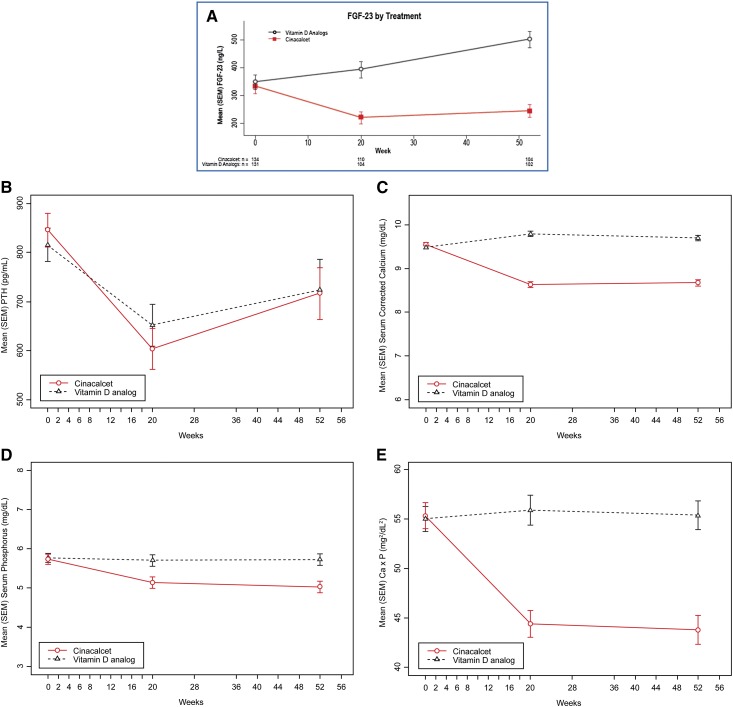
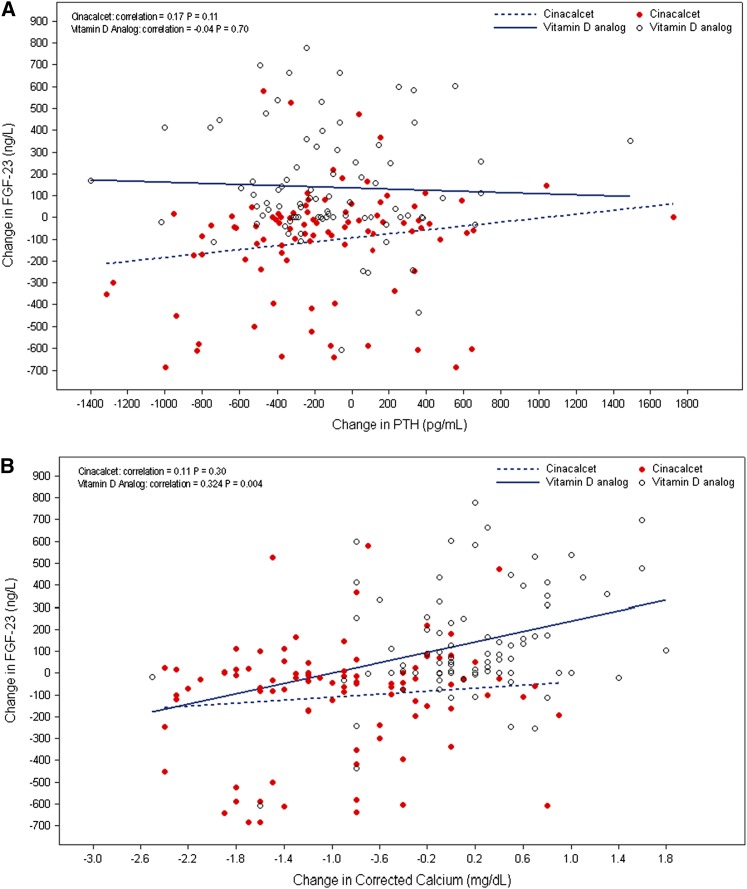
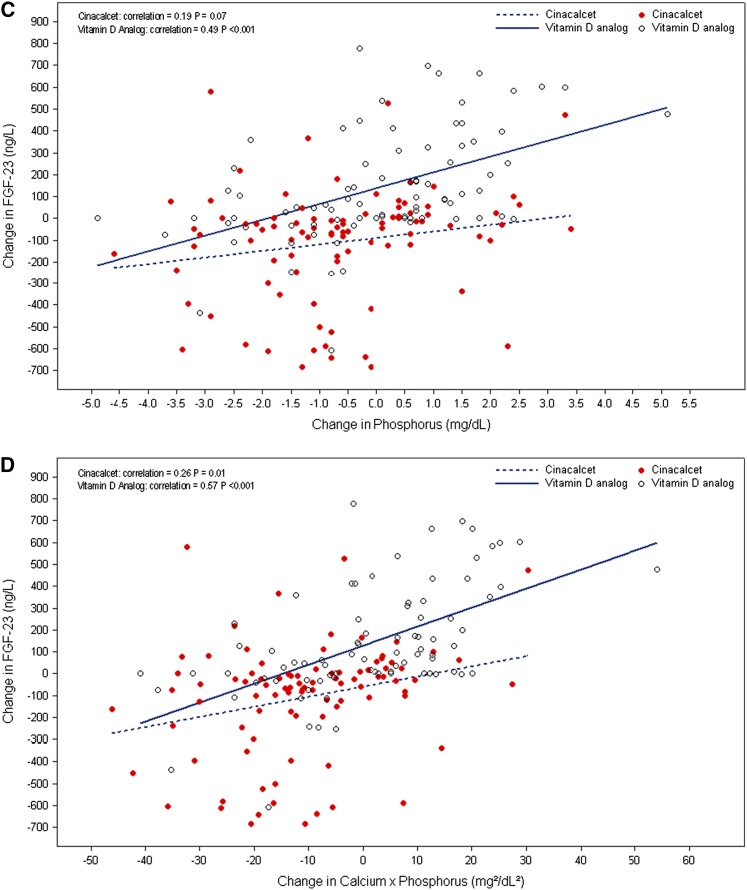
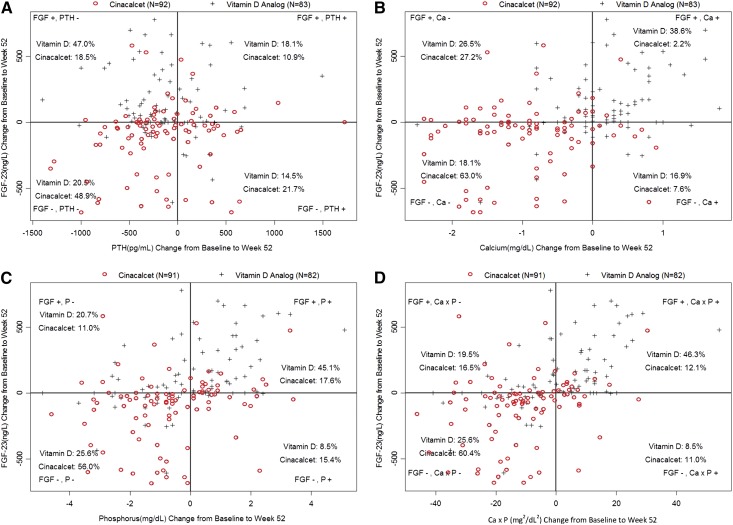
Results: Median (quartiles 1, 3) decrease in FGF-23 concentrations was observed in the cinacalcet arm (-40%; -63%, 16%) compared with median increase in the vitamin D analog arm (47%; 0%, 132%) at week 52 (P<0.001). Changes in FGF-23 in both arms were unrelated to changes in PTH (cinacalcet: r=0.17, P=0.11; vitamin D analog: r=-0.04, P=0.70). Changes in FGF-23 in the vitamin D analog but not the cinacalcet arm were correlated with changes in Ca (cinacalcet: r=0.11, P=0.30; vitamin D analog: r=0.32, P<0.01) and P (cinacalcet: r=0.19, P=0.07; vitamin D analog: r=0.49, P<0.001). Changes in FGF-23 were correlated with changes in Ca×P in both arms (cinacalcet: r=0.26, P=0.01; vitamin D analog: r=0.57, P<0.001). Independent of treatment arm, participants with reductions in P or Ca×P were significantly more likely to show reductions in FGF-23.
Conclusions: During treatment of SHPT, cinacalcet use was associated with a decrease in FGF-23 concentrations, whereas vitamin D analogs were associated with an increase. The divergent effects of these treatments on FGF-23 seem to be independent of modification of PTH. It is possible that effects of cinacalcet and vitamin D analogs on FGF-23 may be mediated indirectly by other effects on bone and mineral metabolism.
Trial registration: ClinicalTrials.gov NCT01181531.
Keywords: ESRD; clinical nephrology; dialysis; hyperparathyroidism.
Copyright © 2015 by the American Society of Nephrology.
Figures
Similar articles
-
A Randomized Trial of Cinacalcet versus Vitamin D Analogs as Monotherapy in Secondary Hyperparathyroidism (PARADIGM).Clin J Am Soc Nephrol. 2015 Jun 5;10(6):1031-40. doi: 10.2215/CJN.07050714. Epub 2015 Apr 22. Clin J Am Soc Nephrol. 2015. PMID: 25904755 Free PMC article. Clinical Trial.
-
Effect of Etelcalcetide vs Cinacalcet on Serum Parathyroid Hormone in Patients Receiving Hemodialysis With Secondary Hyperparathyroidism: A Randomized Clinical Trial.JAMA. 2017 Jan 10;317(2):156-164. doi: 10.1001/jama.2016.19468. JAMA. 2017. PMID: 28097356 Clinical Trial.
-
The effectiveness of cinacalcet: a randomized, open label study in chronic hemodialysis patients with severe secondary hyperparathyroidism.Ren Fail. 2019 Nov;41(1):326-333. doi: 10.1080/0886022X.2018.1562356. Ren Fail. 2019. PMID: 31014177 Free PMC article. Clinical Trial.
-
Cinacalcet HCl: a novel treatment for secondary hyperparathyroidism caused by chronic kidney disease.J Ren Nutr. 2006 Jul;16(3):253-8. doi: 10.1053/j.jrn.2006.04.010. J Ren Nutr. 2006. PMID: 16825031 Review.
-
1alpha(OH)D3 One-alpha-hydroxy-cholecalciferol--an active vitamin D analog. Clinical studies on prophylaxis and treatment of secondary hyperparathyroidism in uremic patients on chronic dialysis.Dan Med Bull. 2008 Nov;55(4):186-210. Dan Med Bull. 2008. PMID: 19232159 Review.
Cited by
-
New scenarios in secondary hyperparathyroidism: etelcalcetide. Position paper of working group on CKD-MBD of the Italian Society of Nephrology.J Nephrol. 2020 Apr;33(2):211-221. doi: 10.1007/s40620-019-00677-0. Epub 2019 Dec 18. J Nephrol. 2020. PMID: 31853791 Free PMC article.
-
The Molecular Basis of Calcium and Phosphorus Inherited Metabolic Disorders.Genes (Basel). 2021 May 13;12(5):734. doi: 10.3390/genes12050734. Genes (Basel). 2021. PMID: 34068220 Free PMC article. Review.
-
FGF23, Biomarker or Target?Toxins (Basel). 2019 Mar 22;11(3):175. doi: 10.3390/toxins11030175. Toxins (Basel). 2019. PMID: 30909513 Free PMC article. Review.
-
Ectopic expression of Klotho in fibroblast growth factor 23 (FGF23)-producing tumors that cause tumor-induced rickets/osteomalacia (TIO).Bone Rep. 2018 Dec 31;10:100192. doi: 10.1016/j.bonr.2018.100192. eCollection 2019 Jun. Bone Rep. 2018. PMID: 30627598 Free PMC article.
-
Effects of etelcalcetide on fibroblast growth factor 23 in patients with secondary hyperparathyroidism receiving hemodialysis.Clin Kidney J. 2019 Apr 26;13(1):75-84. doi: 10.1093/ckj/sfz034. eCollection 2020 Feb. Clin Kidney J. 2019. PMID: 32082556 Free PMC article.
References
-
- Silver J, Naveh-Many T: FGF-23 and secondary hyperparathyroidism in chronic kidney disease. Nat Rev Nephrol 9: 641–649, 2013 - PubMed
-
- Zisman AL, Wolf M: Recent advances in the rapidly evolving field of fibroblast growth factor 23 in chronic kidney disease. Curr Opin Nephrol Hypertens 19: 335–342, 2010 - PubMed
Publication types
MeSH terms
Substances
Associated data
LinkOut - more resources
Full Text Sources
Medical
Miscellaneous
