. 2015 Apr 13;7(2):1759091415578711.
doi: 10.1177/1759091415578711. Print 2015 Mar-Apr.

Cystathionine β-synthase inhibition is a potential therapeutic approach to treatment of ischemic injury

Affiliations

Cystathionine β-synthase inhibition is a potential therapeutic approach to treatment of ischemic injury

Su Jing Chan et al. ASN Neuro. .

Abstract

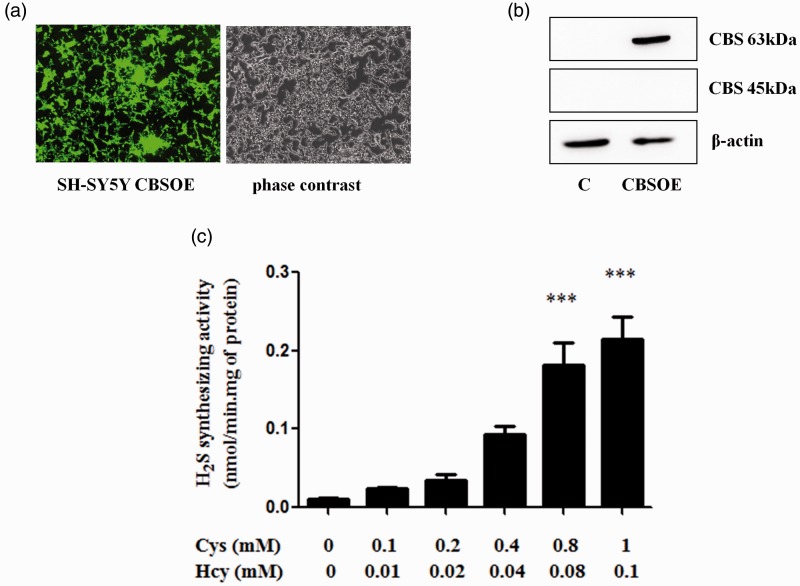
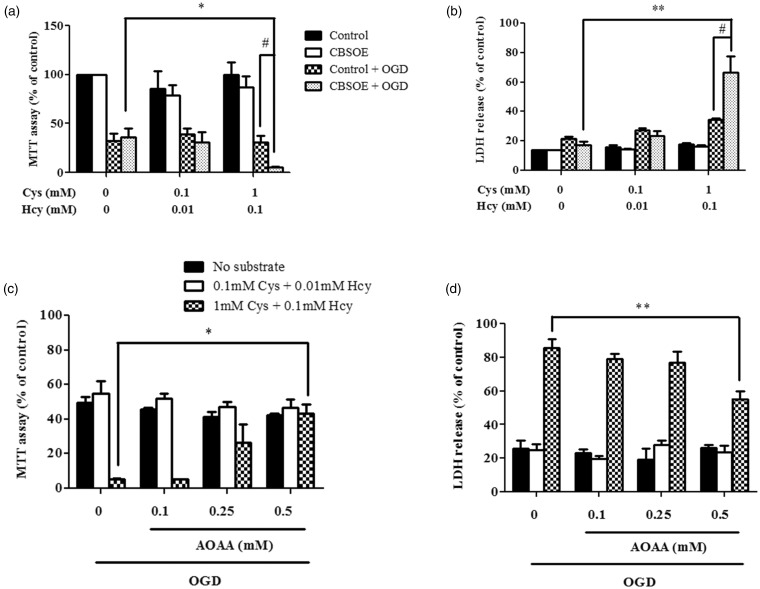
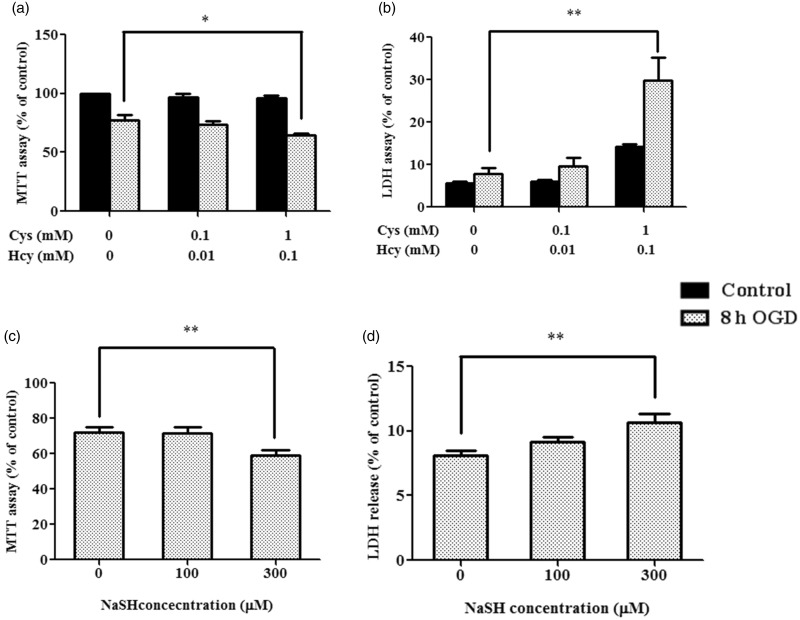
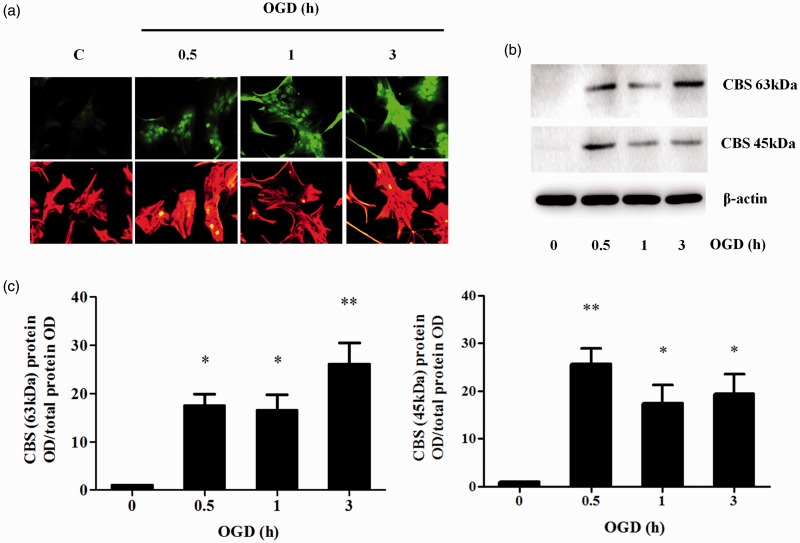
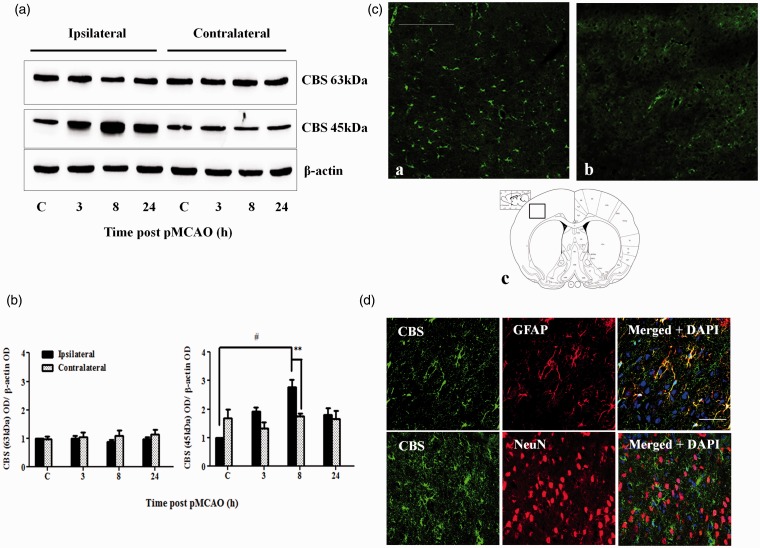
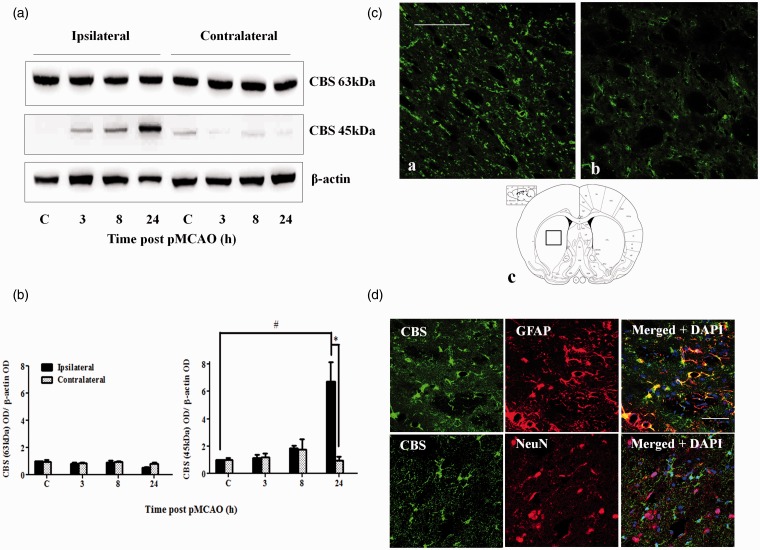
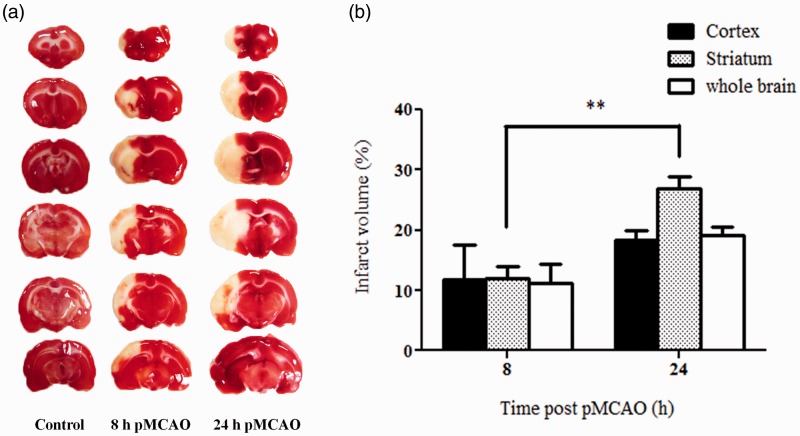
Hydrogen sulfide (H2S) has been reported to exacerbate stroke outcome in experimental models. Cystathionine β-synthase (CBS) has been implicated as the predominant H2S-producing enzyme in central nervous system. When SH-SY5Y cells were transfected to overexpress CBS, these cells were able to synthesize H2S when exposed to high levels of enzyme substrates but not substrate concentrations that may reflect normal physiological conditions. At the same time, these cells demonstrated exacerbated cell death when subjected to oxygen and glucose deprivation (OGD) together with high substrate concentrations, indicating that H2S production has a detrimental effect on cell survival. This effect could be abolished by CBS inhibition. The same effect was observed with primary astrocytes exposed to OGD and high substrates or sodium hydrosulfide. In addition, CBS was upregulated and activated by truncation in primary astrocytes subjected to OGD. When rats were subjected to permanent middle cerebral artery occlusion, CBS activation was also observed. These results imply that in acute ischemic conditions, CBS is upregulated and activated by truncation causing an increased production of H2S, which exacerbate the ischemic injuries. Therefore, CBS inhibition may be a viable approach to stroke treatment.

Keywords: cystathioine β-synthase; cysteine; homocysteine; hydrogen sulfide; oxygen glucose deprivation; stroke.


Figures

Figure 1.
Figure 1.
Lentiviral vector transduced CBS-overexpressing (CBSOE) SH-SY5Y cells. (a) Fluorescence (left) and phase contrast (right) micrographs of SH-SY5Y CBSOE cells. Fluorescence indicates CBS-EGFP expression. (b) Western blot results confirming that CBS was markedly expressed compared with nontransduced control (C) cells. Only the full-length CBS (63 kDa) was detected but not the truncated CBS (45 kDa). (c) H2S synthesizing activity of SH-SY5Y CBSOE cells measured at varying concentrations of cysteine (Cys) and homocysteine (Hcy). Data are presented as mean ± SEM, n = 3. ANOVA: F(5, 12) = 25.125, p < .05; ***p < .001 against no substrate control by Bonferroni. CBS = cystathionine β-synthase; H2S = hydrogen sulfide; ANOVA = analysis of variance; CBSOE = CBS-overexpressing; Cys = cysteine; Hcy = homocysteine.
Figure 2.
Figure 2.
The effects of OGD on cell viability of CBSOE cells under various conditions that affected H2S production. (a and b) MTT assay and LDH release results are used as indicators of cell viability. CBSOE or control SH-SY5Y cells were exposed to either no, low (0.1 mM Cys + 0.01 mM Hcy), or high (1 mM Cys + 0.1 mM Hcy) substrate concentrations with or without 24 hr OGD. Control cells without OGD (a) or cells treated with 2% Triton (b) were used as 100%. ANOVA for CBSOE cells: F(2, 9) = 6.327, p < .05 (a) and F(2, 6) = 15.000, p < .01 (b). *p < .05, **p < .001 against CBSOE cells subjected to OGD without substrates by Bonferroni; #p < .05 against control cells subjected to OGD in the presence of high substrates by independent t test. Data are mean ± SEM, n = 3–4. (c and d) CBS inhibition by AOAA reversed the enhanced cell death in CBSOE cells subjected to OGD in the presence of high substrates. Cell viability is expressed as fraction to control without OGD. ANOVA for high substrate conditions: F(3, 8) = 9.799 (c) and F(3, 12) = 7.322 (d), p < .01. *p < .05, **p < .001 against without AOAA by Bonferroni. Data are mean ± SEM, n = 3–4. OGD = oxygen and glucose deprivation; CBSOE = CBS-overexpressing; H2S = hydrogen sulfide; MTT = 3-(4,5-dimethylthiazol-2-yl)-2,5-diphenyltetrazolium bromide; LDH = lactate dehydrogenase; ANOVA = analysis of variance; CBS = cystathionine β-synthase; AOAA = aminooxyacetic acid; Cys = cysteine; Hcy = homocysteine.
Figure 3.
Figure 3.
Comparison of endogenously produced and exogenous H2S. (a and b) MTT test and LDH release results are used as indicators of cell viability. Primary cortical astrocyte were exposed to either no, low (0.1 mM Cys + 0.01 mM Hcy), or high (1 mM Cys + 0.1 mM Hcy) substrate concentrations with or without 8 hr OGD. Control cells without OGD (a) or cells treated with 2% Triton (b) were used as 100%. Data are presented as mean ± SEM, n = 3–4. ANOVA for 8 hr OGD: F(2, 9) = 5.013, p < .05 (a) and F(2, 9) = 12.107, p < .01 (b). *p < .05, **p < .01 against no substrates by Bonferroni. (c and d) Primary cortical astrocytes were exposed to either 100 or 300 µM NaHS and then subjected to 8 hr OGD. Data are presented as mean ± SEM, n = 4–6 (c) or 8 (d). ANOVA: F(2, 12) = 8.065 (c) and F(2, 21) = 6.988 (d), p < .01. **p < .01 against without NaHS by Bonferroni. H2S = hydrogen sulfide; MTT = 3-(4,5-dimethylthiazol-2-yl)-2,5-diphenyltetrazolium bromide; LDH = lactate dehydrogenase; OGD = oxygen and glucose deprivation; ANOVA = analysis of variance; Cys = cysteine; Hcy = homocysteine.
Figure 4.
Figure 4.
Effects of OGD on CBS expression in primary cultures of cortical astrocytes. (a) Representative immunocytochemical staining of primary cortical astrocytes after OGD (0.5 to 3 hr) for CBS (green) and GFAP (red). (b) Representative Western blot images showing the increased expression of both the full length CBS (63 kDa) and truncated CBS (45 kDa) after OGD. (c) Densitometry measurement of full length (63 kDa) CBS and truncated (45 kDa) CBS expression after OGD. Data are presented as mean ± SEM, n = 3. ANOVA for CBS 63 kDa: F(3, 8) = 12.193, p < .01. *p < .05; **p < .01 against without OGD by Bonferroni. ANOVA for CBS 45 kDa: F(3, 8) = 10.808, p < .05; *p < .05; **p < .01 against without OGD by Bonferroni. OGD = oxygen and glucose deprivation; CBS = cystathionine β-synthase; ANOVA = analysis of variance.
Figure 5.
Figure 5.
CBS expression in the cerebral cortex after pMCAO. (a) Representative Western blot results on CBS expression at 3 to 24 hr post-pMCAO in the cerebral cortex. (b) Densitometry measurement of CBS expression over 24 hr after pMCAO. Protein expression is expressed relative to the ipsilateral control C. Data are presented as mean ± SEM, n = 3–4. ANOVA for CBS 63 kDa on the ipsilateral side: F(3, 12) = 0.608, p = .623. ANOVA for CBS 45 kDa on the ipsilateral side: F(3, 8) = 6.702, p < .05; #p < .05 against ipsilateral control by Bonferroni; **p < .005 against the contralateral side by independent t test. (c) Immunofluorescent staining of CBS showed increased CBS expression in the cortex 8 hr after pMCAO (a) compared with sham-control rats (b). Scale bar: 200 µm. (c) shows the location where the CBS immunofluorescent photomicrographs were taken. (d) Colocalization of CBS (green) and GFAP (red, top panel) and lack of colocalization of CBS (green) and NeuN (red, bottom panel) in the cortex at 8 hr after pMCAO. Scale bar: 50 µm. CBS = cystathionine β-synthase; pMCAO = permanent middle cerebral artery occlusion; ANOVA = analysis of variance.
Figure 6.
Figure 6.
CBS expression in the striatum after pMCAO. (a) Representative Western blot results on CBS expression at 3 to 24 hr post-pMCAO in the striatum. (b) Densitometry measurement of CBS expression over 24 hr after pMCAO. Protein expression is expressed relative to the ipsilateral control C. Data are presented as mean ± SEM, n = 3–4. ANOVA for CBS 63 kDa: F(3, 8) = 3.524, p = .068. ANOVA for CBS 45 kDa: F(3, 8) = 13.637, p < .05; #p < .05 against the ipsilateral control by Bonferroni; *p < .05 against the contralateral by independent t test. (c) Immunofluorescent staining of CBS showed increased CBS expression in the striatum 24 hr after pMCAO (a) compared with sham-control rats (b). Scale bar: 200 µm. (c) shows the location where the CBS immunofluorescent photomicrographs were taken. (d) Colocalization of CBS (green) and GFAP (red, top panel) and lack of colocalization of CBS (green) and NeuN (red, bottom panel) in the striatum at 24 hr after pMCAO. Scale bar: 50 µm. CBS = cystathionine β-synthase; pMCAO = permanent middle cerebral artery occlusion; ANOVA = analysis of variance.
Figure 7.
Figure 7.
Infarct volumes at 8 and 24 hr post-pMCAO. (a) Representative TTC-stained sections showing unstained infarct areas. (b) Infarct volumes are calculated as % of total volume of the brain region after correction for edema using the contralateral hemisphere as control and presented as mean ± SEM, n = 3. *p < .01 by independent t test. TTC = 2,3,5-triphenyltetrazolium chloride; pMCAO = permanent middle cerebral artery occlusion.

Similar articles

Cited by

  • Upregulation of cystathionine β-synthase and p70S6K/S6 in neonatal hypoxic ischemic brain injury.
    Lechpammer M, Tran YP, Wintermark P, Martínez-Cerdeño V, Krishnan VV, Ahmed W, Berman RF, Jensen FE, Nudler E, Zagzag D. Lechpammer M, et al. Brain Pathol. 2017 Jul;27(4):449-458. doi: 10.1111/bpa.12421. Epub 2016 Aug 28. Brain Pathol. 2017. PMID: 27465493 Free PMC article.
  • Sulfide catabolism ameliorates hypoxic brain injury.
    Marutani E, Morita M, Hirai S, Kai S, Grange RMH, Miyazaki Y, Nagashima F, Traeger L, Magliocca A, Ida T, Matsunaga T, Flicker DR, Corman B, Mori N, Yamazaki Y, Batten A, Li R, Tanaka T, Ikeda T, Nakagawa A, Atochin DN, Ihara H, Olenchock BA, Shen X, Nishida M, Hanaoka K, Kevil CG, Xian M, Bloch DB, Akaike T, Hindle AG, Motohashi H, Ichinose F. Marutani E, et al. Nat Commun. 2021 May 25;12(1):3108. doi: 10.1038/s41467-021-23363-x. Nat Commun. 2021. PMID: 34035265 Free PMC article.
  • Modulator of apoptosis-1 is a potential therapeutic target in acute ischemic injury.
    Chan SJ, Zhao H, Hayakawa K, Chai C, Tan CT, Huang J, Tao R, Hamanaka G, Arumugam TV, Lo EH, Yu VCK, Wong PH. Chan SJ, et al. J Cereb Blood Flow Metab. 2019 Dec;39(12):2406-2418. doi: 10.1177/0271678X18794839. Epub 2018 Aug 22. J Cereb Blood Flow Metab. 2019. PMID: 30132384 Free PMC article.
  • CBS promoter hypermethylation increases the risk of hypertension and stroke.
    Wang C, Xu G, Wen Q, Peng X, Chen H, Zhang J, Xu S, Zhang C, Zhang M, Ma J, Hui Z, Wu G, Ma M. Wang C, et al. Clinics (Sao Paulo). 2019 Mar 21;74:e630. doi: 10.6061/clinics/2019/e630. Clinics (Sao Paulo). 2019. PMID: 30916171 Free PMC article.
  • The role of medical gas in stroke: an updated review.
    Zhang ZY, Fang YJ, Luo YJ, Lenahan C, Zhang JM, Chen S. Zhang ZY, et al. Med Gas Res. 2019 Oct-Dec;9(4):221-228. doi: 10.4103/2045-9912.273960. Med Gas Res. 2019. PMID: 31898607 Free PMC article. Review.

References

    1. Abe K., Kimura H. (1996) The possible role of hydrogen sulfide as an endogenous neuromodulator. Journal of Neuroscience 16: 1066–1071. - PMC - PubMed
    1. Abramov A. Y., Scorziello A., Duchen M. R. (2007) Three distinct mechanisms generate oxygen free radicals in neurons and contribute to cell death during anoxia and reoxygenation. Journal of Neuroscience 27: 1129–1138. - PMC - PubMed
    1. Asimakopoulou A., Panopoulos P., Chasapis C. T., Coletta C., Zhou Z., Cirino G., Papapetropoulos A. (2013) Selectivity of commonly used pharmacological inhibitors for cystathionine beta synthase (CBS) and cystathionine gamma lyase (CSE). British Journal of Pharmacology 169: 922–932. - PMC - PubMed
    1. Beauchamp R. O., Jr., Bus J. S., Popp J. A., Boreiko C. J., Andjelkovich D. A. (1984) A critical review of the literature on hydrogen sulfide toxicity. Critical Reviews in Toxicology 13: 25–97. - PubMed
    1. Calvert J. W., Coetzee W. A., Lefer D. J. (2010) Novel insights into hydrogen sulfide-mediated cytoprotection. Antioxidants & Redox Signaling 12: 1203–1217. - PMC - PubMed

Publication types

MeSH terms

LinkOut - more resources