Multicenter Study
. 2015 Sep;35(9):1485-93.
doi: 10.1038/jcbfm.2015.66. Epub 2015 Apr 15.

Quantification of blood flow-dependent component in estimates of beta-amyloid load obtained using quasi-steady-state standardized uptake value ratio

Affiliations
Multicenter Study

Quantification of blood flow-dependent component in estimates of beta-amyloid load obtained using quasi-steady-state standardized uptake value ratio

Zsolt Cselényi et al. J Cereb Blood Flow Metab. 2015 Sep.

Abstract

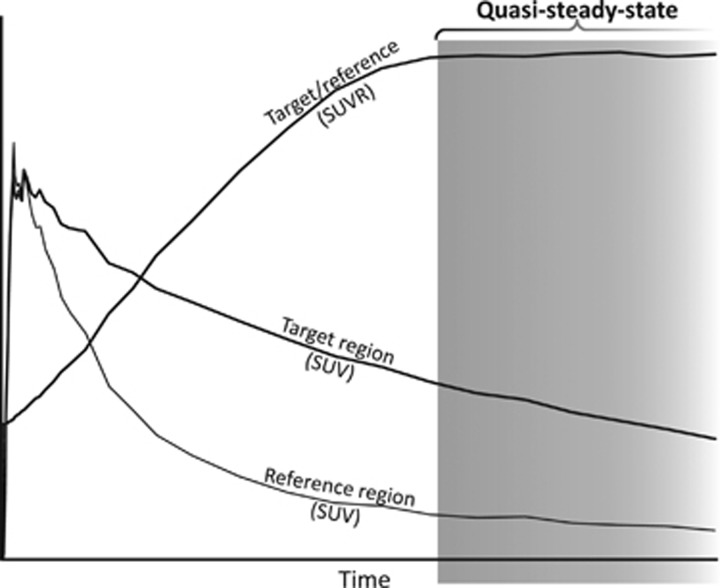
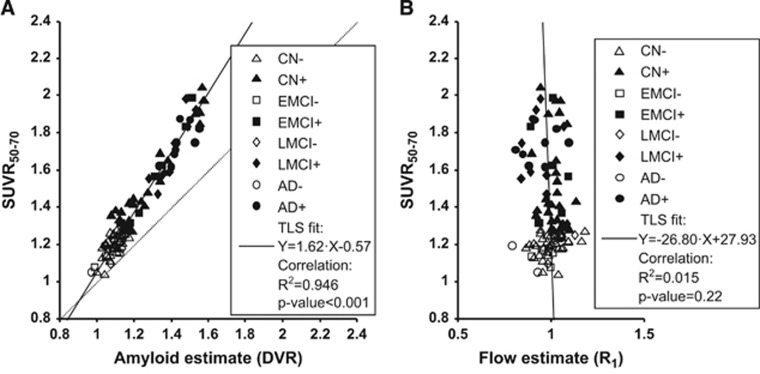
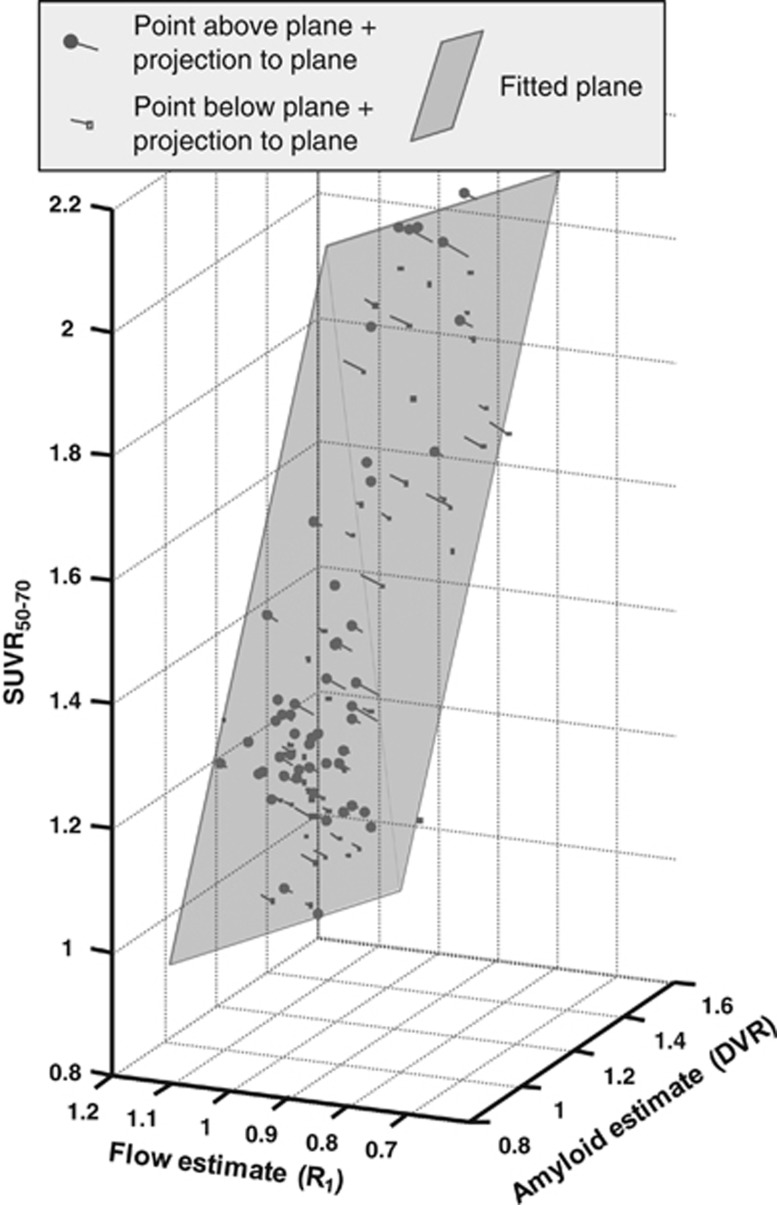
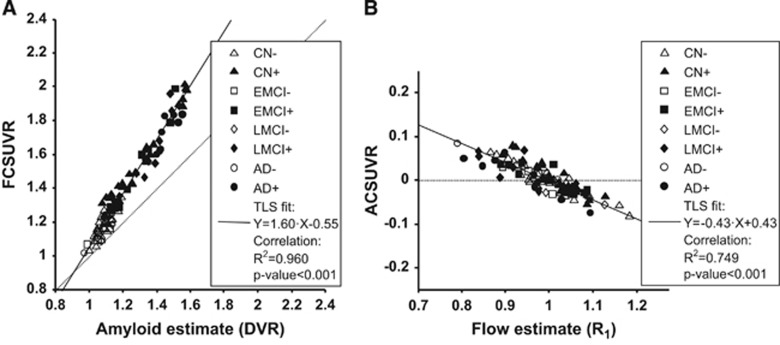
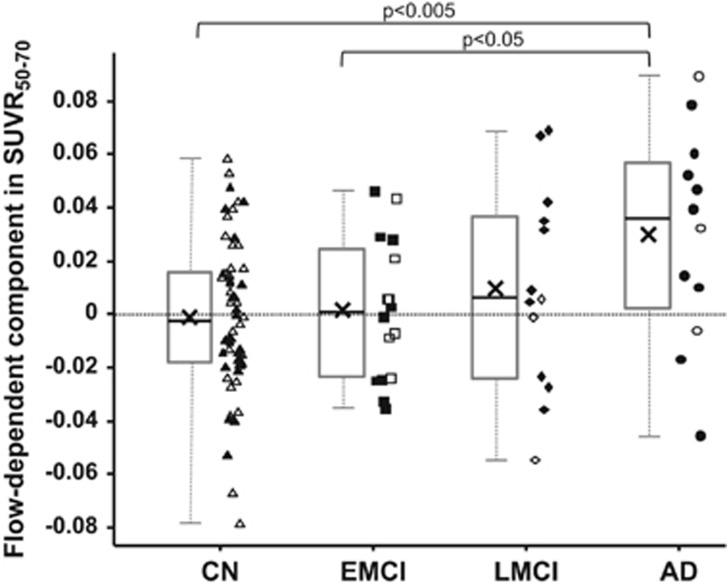
Longitudinal positron emission tomography (PET) imaging of beta-amyloid is used in basic research and in drug efficacy trials in Alzheimer's disease (AD). However, the extent of amyloid accumulation after clinical onset is not fully known. Importantly, regional PET data are typically quantified using the standardized uptake value ratio (SUVR), which according to simulations is sensitive to changes in regional cerebral blood flow (rCBF). We aimed to better understand the potentials of longitudinal amyloid imaging by disentangling the influence of blood flow on SUVR using experimental data. [18F]AV-45 PET data from 101 subjects, ranging from cognitively normal to AD patients, in the Alzheimer's Disease Neuroimaging Initiative were extracted. The relationship between global cortical distribution volume ratio, indicator of rCBF (R1), and SUVR was examined using multilinear regression. There was a significant effect of rCBF on SUVR. The effect increased by disease severity. Results suggest that changes in rCBF can produce apparent changes in SUVR in AD. Therefore, future longitudinal studies should measure amyloid changes in a way not sensitive to this effect, ideally using quantitative PET imaging. Furthermore, the results suggest no true accumulation beyond clinical onset and highlight the risks of longitudinal amyloid imaging in drug trials in AD.


Figures

Figure 1
Figure 1
Schematic plot to illustrate quasi-steady-state (secular equilibrium) phase of radioligand binding. In this phase, the radioligand is washing out from both regions rich in amyloid (target) and devoid of amyloid (reference). The ratio of regional radioactivity between target and reference is near horizontal or slowly increasing. The quasi-steady-state phase in principle is open ended, in practice bracketed by complete radioactive decay and radioligand elimination from the body many hours after injection. SUVR, standardized uptake value ratio.
Figure 2
Figure 2
Regression of SUVR50–70 values against estimates of amyloid and relative flow, respectively. For illustration purposes, subjects with high and low amyloid load were separated using the SUVR50–70 cutoff of 1.277, which was obtained by converting the typical [11C]PIB threshold of 1.47 using the regression line in (B) of Landau's paper (showing [18F]AV-45 versus [11C]PIB data based on cerebellar gray matter as the reference region). Scatter plots show global cortical variables in all subjects (N=101). Individual symbols indicate group membership and amyloid positivity (see legend for details). Solid line shows total least squares (TLS) fitted line (equation in legend, together with results of simple linear correlation). (A) SUVR50–70 values versus amyloid binding estimates (DVR). (B) SUVR50–70 values versus relative blood flow estimates (R1). AD, Alzheimer's disease; CN, cognitively normal; EMCI, early mild cognitive impairment; LMCI, mild cognitive impairment; SUVR, standardized uptake value ratio.
Figure 3
Figure 3
Orthographic projection of three-dimensional scatter plot showing input data entered into multivariate total least squares (TLS) analysis (N=101 parameter triplets). Gray semi-transparent plane indicates the TLS fitted plane (equation: SUVR50–70=1.60 × DVR−0.43 × R1−0.12) with lines connecting data points perpendicularly to the plane (i.e., showing the vectors defined by ɛ1, ɛ2, and ɛ3). Data points above plane are shown with filled round symbols, those below with empty square symbols. DVR, distribution volume ratio; SUVR, standardized uptake value ratio.
Figure 4
Figure 4
Regression of corrected SUVR50–70 values against estimates of amyloid and relative flow, respectively. Scatter plots show global cortical variables in all subjects (N=101). Individual symbols indicate group membership and amyloid positivity (see legend for details). Solid line shows total least squares (TLS) fitted line (equation in legend, together with results of simple linear correlation). (A) SUVR50–70 values after removing flow-dependent component (FCSUVR) versus amyloid binding estimates (DVR). (B) SUVR50–70 values after removing amyloid-dependent component (ACSUVR) versus relative blood flow estimates (R1). AD, Alzheimer's disease; CN, cognitively normal; EMCI, early mild cognitive impairment; LMCI, mild cognitive impairment; SUVR, standardized uptake value ratio.
Figure 5
Figure 5
Box plots of flow-dependent component in SUVR50–70 in the four subject groups: CN, EMCI, LMCI, and AD. The gray boxes indicate the upper and lower quartiles, the black lines in the boxes show the median, the black × marker the mean and the whiskers indicate the minimum and maximum values. Individual data points are also plotted with open symbols showing amyloid negativity and filled symbols indicating amyloid positivity. Points are randomly shifted horizontally to decrease visual clutter. Significant group differences are indicated above the plot with the corresponding P-value cutoff (two-tailed, two-sample t-test). AD, Alzheimer's disease; CN, cognitively normal; EMCI, early mild cognitive impairment; LMCI, mild cognitive impairment; SUVR, standardized uptake value ratio.

References

    1. 1Koo J, Byun Y. Current status of PET-imaging probes of β-amyloid plaques. Arch Pharm Res 2013; 36: 1178–1184. - PubMed
    1. 2Choi SR, Schneider JA, Bennett DA, Beach TG, Bedell BJ, Zehntner SP et al. Correlation of amyloid PET ligand florbetapir F 18 binding with Aβ aggregation and neuritic plaque deposition in postmortem brain tissue. Alzheimer Dis Assoc Disord 2012; 26: 8–16. - PMC - PubMed
    1. 3Clark CM, Pontecorvo MJ, Beach TG, Bedell BJ, Coleman RE, Doraiswamy PM et al. Cerebral PET with florbetapir compared with neuropathology at autopsy for detection of neuritic amyloid-β plaques: a prospective cohort study. Lancet Neurol 2012; 11: 669–678. - PubMed
    1. 4Driscoll I, Troncoso JC, Rudow G, Sojkova J, Pletnikova O, Zhou Y et al. Correspondence between in vivo (11)C-PiB-PET amyloid imaging and postmortem, region-matched assessment of plaques. Acta Neuropathol 2012; 124: 823–831. - PMC - PubMed
    1. 5Wolk DA, Grachev ID, Buckley C, Kazi H, Grady MS, Trojanowski JQ et al. Association between in vivo fluorine 18-labeled flutemetamol amyloid positron emission tomography imaging and in vivo cerebral cortical histopathology. Arch Neurol 2011; 68: 1398–1403. - PMC - PubMed

Publication types

Substances

LinkOut - more resources