. 2015 Aug;32(8):2015-35.
doi: 10.1093/molbev/msv082. Epub 2015 Apr 14.

A Phylogenetic Analysis of 34 Chloroplast Genomes Elucidates the Relationships between Wild and Domestic Species within the Genus Citrus

Affiliations

A Phylogenetic Analysis of 34 Chloroplast Genomes Elucidates the Relationships between Wild and Domestic Species within the Genus Citrus

Jose Carbonell-Caballero et al. Mol Biol Evol. 2015 Aug.

Abstract

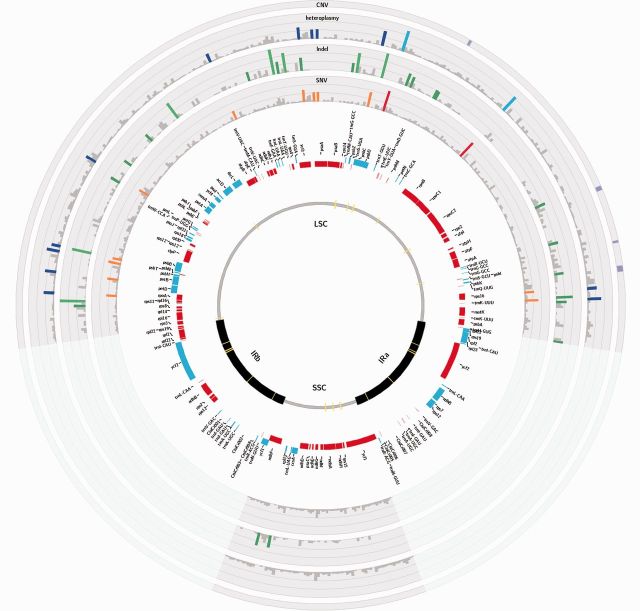
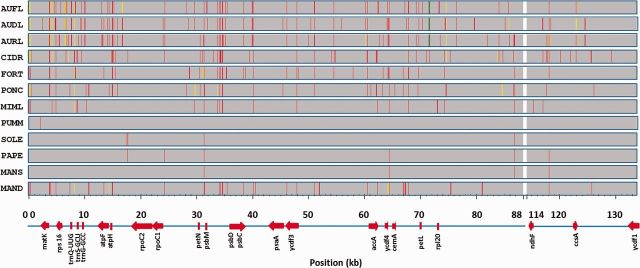
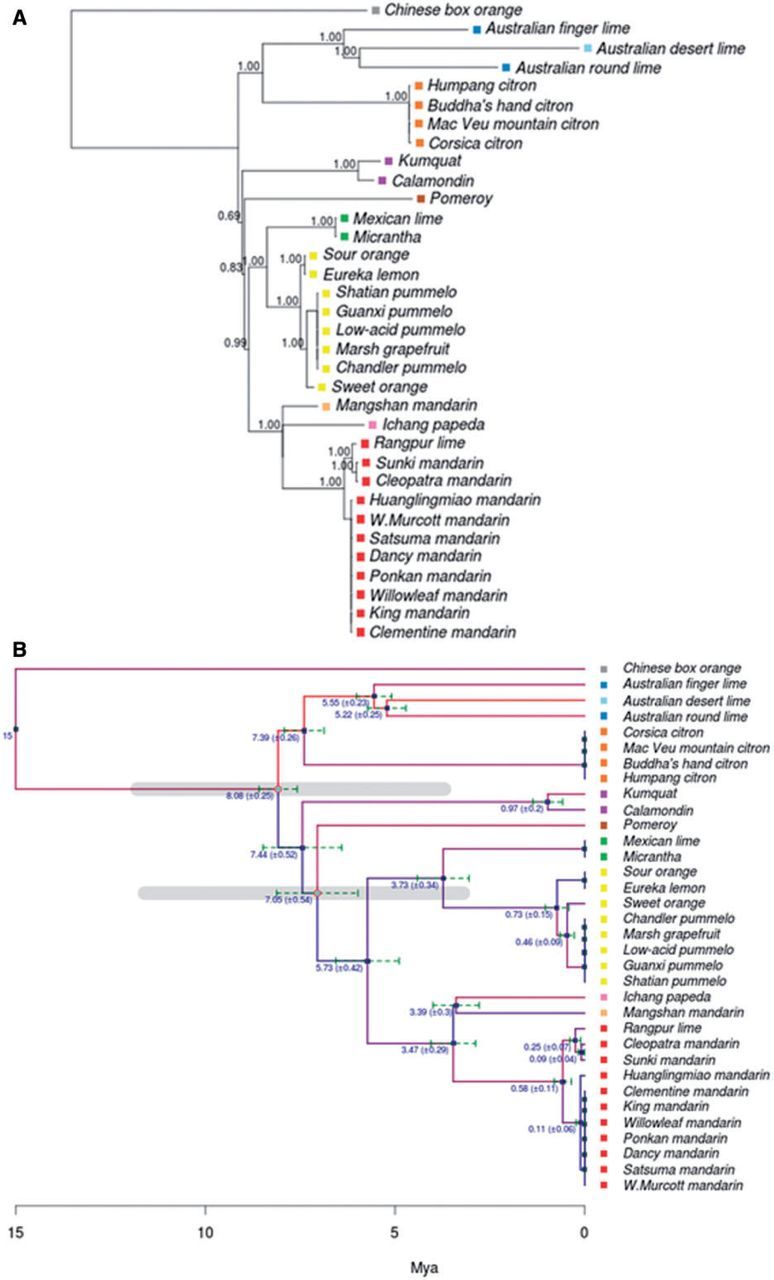
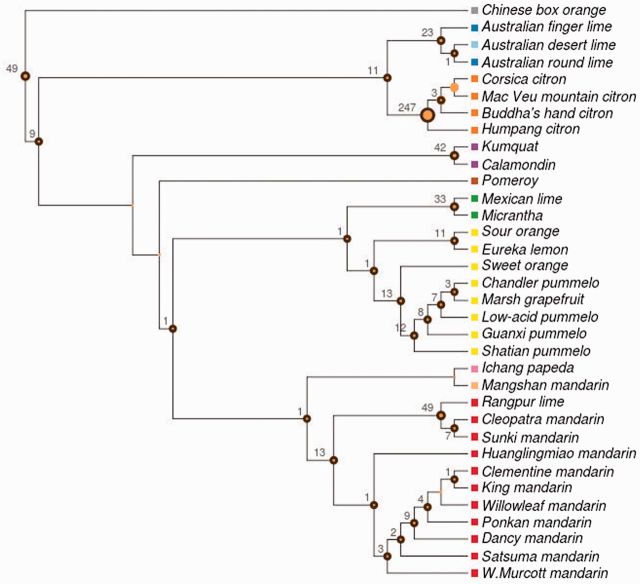
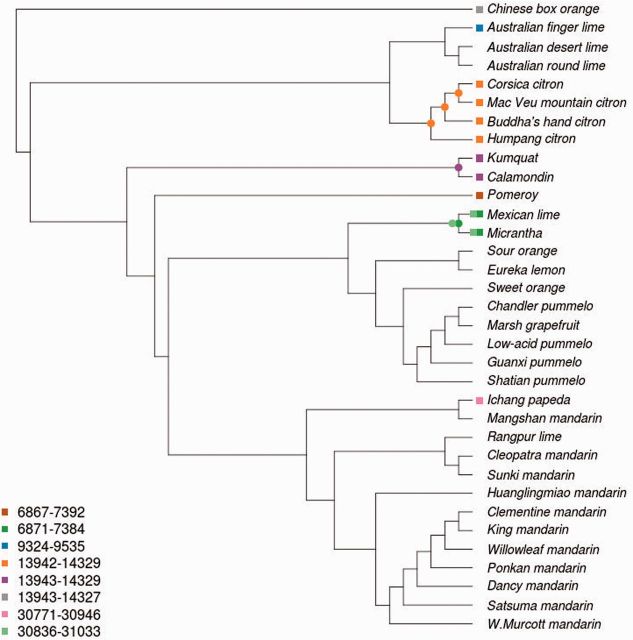
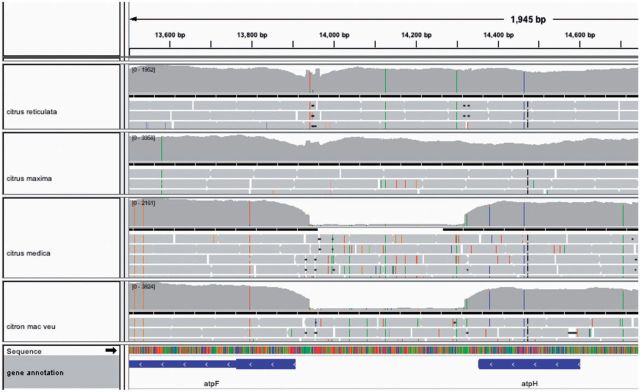
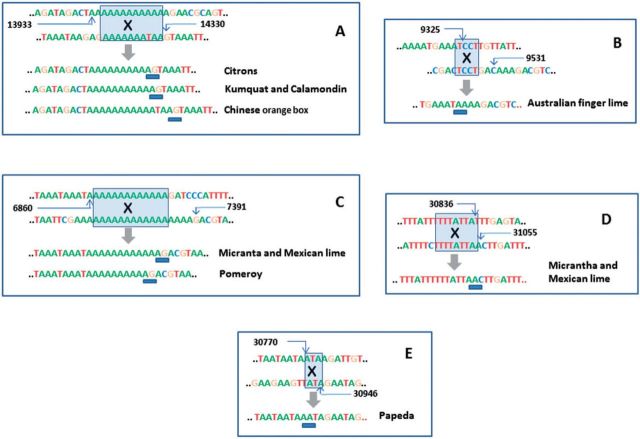
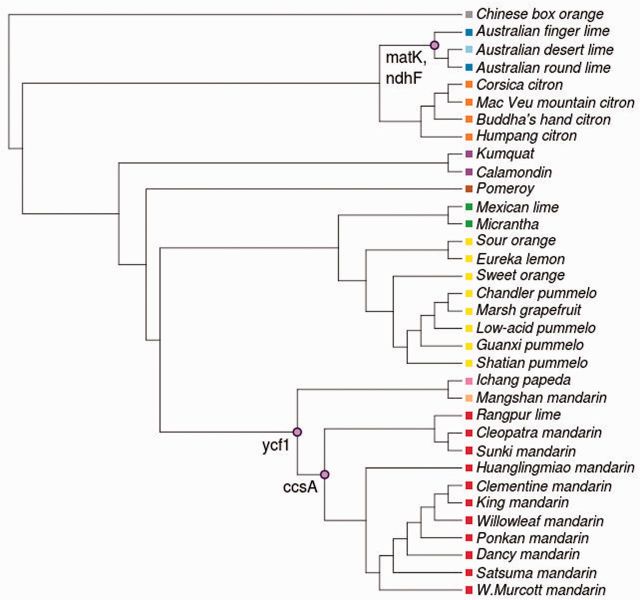
Citrus genus includes some of the most important cultivated fruit trees worldwide. Despite being extensively studied because of its commercial relevance, the origin of cultivated citrus species and the history of its domestication still remain an open question. Here, we present a phylogenetic analysis of the chloroplast genomes of 34 citrus genotypes which constitutes the most comprehensive and detailed study to date on the evolution and variability of the genus Citrus. A statistical model was used to estimate divergence times between the major citrus groups. Additionally, a complete map of the variability across the genome of different citrus species was produced, including single nucleotide variants, heteroplasmic positions, indels (insertions and deletions), and large structural variants. The distribution of all these variants provided further independent support to the phylogeny obtained. An unexpected finding was the high level of heteroplasmy found in several of the analyzed genomes. The use of the complete chloroplast DNA not only paves the way for a better understanding of the phylogenetic relationships within the Citrus genus but also provides original insights into other elusive evolutionary processes, such as chloroplast inheritance, heteroplasmy, and gene selection.

Keywords: chloroplast genome; citrus; heteroplasmy; phylogeny; selection.


Figures

F<sc>ig</sc>. 1.
Fig. 1.
Variability of the genus Citrus represented over the Circular map of the Citrus sinensis chloroplast genome. The two inverted repeat regions (IRa and IRb) separate the large (LSC) and small (SSC) single copy regions, respectively. The yellow lines in the innermost circle correspond to regions with homology to nuclear sequences. Genes represented by blue rectangles are on positive strand, whereas genes represented by red rectangles are on negative strand. Density of SNVs and indels is represented by colored bars. Higher density of SNVs and indels is represented by darker bars. Heteroplasmy and large CNV are also depicted along the genome.
F<sc>ig</sc>. 2.
Fig. 2.
Distribution of indels along the chloroplast citrus genomes in 100-bp nonoverlapping windows. MAND, mandarins (Clementine, Willowleaf, Ponkan, Satsuma, Dancy, King, W Murcott, Huanglingmiao, Cleopatra, Sunki, and Rangpur lime); MANS, Mangshan mandarin; PAPE, Ichang papeda; SOLE, Sour orange and Eureka lemon; PUMM, pummelos and grapefruits (Chandler, low-acid, Guanxi, Shatian, and Marsh); MIML, Micrantha and Mexcian lime; PONC, Pomeroy; FORT, Calamondin and kumquat; CIDR, citrons (Buddah’s Hand, Mac Veu Montain, Humpang, and Corsican); AURL, Australian round lime; AUDL, Australian desert lime; and AUFL, Australian finger lime. The Citrus sinensis chloroplast genome was used as the reference genome and the two inverted repeats IRa (133–160 kb) and IRb (88–114 kb) of this genome were not included in the study. Colors represent number of indels: red: 1; yellow: 2; and green: 3. Positions of genes cited in the text are depicted as reference.
F<sc>ig</sc>. 3.
Fig. 3.
Phylogenetic tree of the genus Citrus. (A) Maximum-likelihood phylogenetic tree inferred using PhyML from the set of variant loci from 34 citrus genomes. Colors represent the main chloroplast groups (gray SB, blue MI, light blue ER, orange CI, purple FO, brown PO, green MC, yellow PU, pink PA, light orange MN, and red MA; see table 1). Bootstrap CIs for the clades are displayed in the corresponding branching points of the tree. Support values have been removed from collapsed branches. (B) Calibrated phylogenetic tree obtained by using correlated relaxed clock model with inferred speciation dates over a time scale in million years. The tree was calibrated using previous published estimations of citrus divergence times that date the separation between Severinia and the genus Citrus approximately 13 Ma, with a range of uncertainty from 20 to 8 Ma (Pfeil and Crisp 2008). This event was taken as the root of the tree. Other two events used for calibration were the first separation of citrus between the two main citrus clades and the Poncirus divergence that occurred 7.1 Ma (11.8–3.7 Ma) and 6.6 Ma (11.6–3.2 Ma), respectively (Pfeil and Crisp 2008), indicated as gray lines in the figure. 95% CIs for the speciation events, defined as 2SD, are marked as green dashed bars in the corresponding branching points. Low mutation rates are represented by blue branches, whereas high mutation rates are represented by red branches. Colored squares that precede accession names represent the main chloroplast groups.
F<sc>ig</sc>. 4.
Fig. 4.
Ancestral inference of heteroplasmic events per node. Node size is proportional to the amount of heteroplasmic events occurred on each corresponding node. Colors represent the main chloroplast groups as indicated for figure 3. Circles with black border indicate hypothetical origins of heteroplasmic events.
F<sc>ig</sc>. 5.
Fig. 5.
Distribution and evolution of structural variants along the citrus phylogeny. Eight structural variants observed in the different species are represented as squares of different color. The figure legend represents the genomic coordinates of the different SVs (some of them overlap due to the small portion of the chloroplast genome that can be lost without affecting functionality). The inferred evolutionary origin of the different SVs along the evolutionary tree of the Citrus genus is represented with a circle of the same color than the corresponding SV.
F<sc>ig</sc>. 6.
Fig. 6.
Observed coverage of mapped reads supporting the existence of a large deletion. IGV screenshot of the variability and coverage observed in four citrus sequence samples. Upper panel represents the genomic coordinates. There are four panels corresponding to the different citrus sequences. Each of these panels is subdivided into different racks. The upper track describes the density of read mapping. Then, there are three or four tracks that represent the three or four rows of mapping sequences. Thin dashes across the reads represent positions that change in the read with respect to the Citrus sinensis chloroplast reference genome. The two panels in the bottom of the figure represent the lineal DNA sequence with all the variants found and the genes and other genomic annotations. The deletion is located in a narrow genomic region between the atpF and atpH genes. In the example, two species, Citrus maxima and Citus reticulata have the region whereas Citrus medica and Citron mac veu display a clear deletion.
F<sc>ig</sc>. 7.
Fig. 7.
Sequences of breakpoint flanking regions of various deletions in chloroplast genomes of citrus. In each panel, the two first sequences that contain reference positions, correspond to the two separate regions involved in the deletions while the resulting rearrangement are indicated below the wide arrow. The shade boxes denote homologous stretches in the original sequences; the X indicates putative crossovers between the homologous sequences and the blue bars show the exact junction. (A) All citrons share a deletion spanning positions 13943–14330 that overlaps with an independent deletion spanning positions 13944–14330 in Kumquat and Calmondin and with that of Chinese orange box at positions 13946–14330. (B) Australian finger lime contains a deletion spanning positions 9325–9531. (C–E) Micrantha and Mexican lime share two deletions; one of them spanning positions 6871–7391 overlaps with an independent deletion spanning positions 6869–7391 in Pomeroy. The other deletion, spanning positions 30836–31055 partially overlaps the deletion at positions 30770–30946 of Papeda.
F<sc>ig</sc>. 8.
Fig. 8.
Events of positive selection in genes located in the corresponding lineage of the evolutionary tree. Colors represent the main chloroplast groups (gray SB, blue MI, light blue ER, orange CI, purple FO, brown PO, green MC, yellow PU, pink PA, light orange MN, and red MA). Circles represent branches of the tree where genes were significantly under positive selection. The names of the genes are represented near the circles.
F<sc>ig</sc>. 9.
Fig. 9.
Two possible scenarios for the generation of hybrids. On the left part of the figure, the variability of the species is generated time ago (400,000 years) one of the varieties is cultivated (M, which is the maternal parent species). A different species (P) is crossed as paternal parent with another variety, whose chloroplast genome is (except for the heteroplasmy traces) lost. Both variants are cultivated systematically 3,000 years ago and most of the natural variability of the species disappears. The phylogeny recovered will reflect the moment in which the intraspecific variability was generated 400,000 years ago. A completely different scenario is shown in the right part of the figure. In this case, the variety chosen for the cross is the one which is cultivated. Then, the resultant phylogeny will reflect the moment of the cross, about 3,000 years ago.

Comment in

References

    1. Akaike H. A new look at the statistical model identification. IEEE Trans Automat Contr. 1974;19:716–723.
    1. Altschul SF, Gish W, Miller W, Myers EW, Lipman DJ. Basic local alignment search tool. J Mol Biol. 1990;215:403–410. - PubMed
    1. Araujo E, Queiroz L, Machado M. What is Citrus? Taxonomic implications from a study of cp-DNA evolution in the tribe Citreae (Rutaceae subfamily Aurantioideae) Org Divers Evol. 2003;3:55–62.
    1. Asadi Abkenar A, Isshiki S, Tashiro Y. Phylogenetic relationships in the “true citrus fruit trees” revealed by PCR-RFLP analysis of cpDNA. Sci Hortic (Amsterdam). 2004;102:233–242.
    1. Barkley N, Roose M, Krueger R, Federici CT. Assessing genetic diversity and population structure in a citrus germplasm collection utilizing simple sequence repeat markers (SSRs) Theor Appl Genet. 2006;112:1519–1531. - PubMed

Publication types

Substances

LinkOut - more resources