. 2015 Jun;66(11):3367-80.
doi: 10.1093/jxb/erv147. Epub 2015 Apr 6.

Pepper aldehyde dehydrogenase CaALDH1 interacts with Xanthomonas effector AvrBsT and promotes effector-triggered cell death and defence responses

Affiliations

Pepper aldehyde dehydrogenase CaALDH1 interacts with Xanthomonas effector AvrBsT and promotes effector-triggered cell death and defence responses

Nak Hyun Kim et al. J Exp Bot. 2015 Jun.

Abstract

Xanthomonas type III effector AvrBsT induces hypersensitive cell death and defence responses in pepper (Capsicum annuum) and Nicotiana benthamiana. Little is known about the host factors that interact with AvrBsT. Here, we identified pepper aldehyde dehydrogenase 1 (CaALDH1) as an AvrBsT-interacting protein. Bimolecular fluorescence complementation and co-immunoprecipitation assays confirmed the interaction between CaALDH1 and AvrBsT in planta. CaALDH1:smGFP fluorescence was detected in the cytoplasm. CaALDH1 expression in pepper was rapidly and strongly induced by avirulent Xanthomonas campestris pv. vesicatoria (Xcv) Ds1 (avrBsT) infection. Transient co-expression of CaALDH1 with avrBsT significantly enhanced avrBsT-triggered cell death in N. benthamiana leaves. Aldehyde dehydrogenase activity was higher in leaves transiently expressing CaALDH1, suggesting that CaALDH1 acts as a cell death enhancer, independently of AvrBsT. CaALDH1 silencing disrupted phenolic compound accumulation, H2O2 production, defence response gene expression, and cell death during avirulent Xcv Ds1 (avrBsT) infection. Transgenic Arabidopsis thaliana overexpressing CaALDH1 exhibited enhanced defence response to Pseudomonas syringae pv. tomato and Hyaloperonospora arabidopsidis infection. These results indicate that cytoplasmic CaALDH1 interacts with AvrBsT and promotes plant cell death and defence responses.

Keywords: Aldehyde dehydrogenase; Xanthomonas campestris pv. vesicatoria.; cell death; effector AvrBsT; pepper; plant defence.


Figures

Fig. 1.
Fig. 1.
AvrBsT interacts with CaALDH1 in yeast and in planta. (A) Yeast two-hybrid assay. CaALDH1 and AvrBsT fused with GAL4 activation domain (AD) or binding domain (BD) were co-introduced into Saccharomyces cerevisiae strain AH109, and reporter gene activation was monitored on synthetic dropout (SD)-AHLT (minus adenine, histidine, leucine, and tryptophan) medium containing X-α-gal. Combinations of Lam and p53 with SV40-T were used as negative and positive controls, respectively. (B) Co-immunoprecipitation analyses of transiently expressed CaALDH1:HA and AvrBsT:cMyc in N. benthamiana leaves. Extracted proteins were immunoprecipitated with α-cMyc or α-HA beads, and immunoblotted with α-cMyc and α-HA antibodies. (C) Bimolecular fluorescence complementation images of interactions between AvrBsT and CaALDH1 in N. benthamiana leaves. YFP fluorescence was visualized 30h after agroinfiltration using a confocal laser scanning microscope. bZIP63:YFPN and bZIP63:YFPC constructs were used as positive controls. Bars=50 µm. (D) Immunoblot analyses of YFP fusion proteins transiently expressed in N. benthamiana leaves. Protein loading was visualized by Coomassie brilliant blue (CBB) staining. (This figure is available in colour at JXB online.)
Fig. 2.
Fig. 2.
RNA gel blot analysis of CaALDH1 expression in pepper leaves infected with virulent Ds1 (EV) or avirulent Ds1 (avrBsT) Xcv. RNA extracted from pepper plants was blotted to nylon membrane and hybridized with 32P-labelled CaALDH1 probes. rRNA is shown as a loading control. H, healthy leaves; Mock, treated with 10mM MgCl2; EV, empty vector.
Fig. 3.
Fig. 3.
Subcellular localization of CaALDH1. Agrobacterium-mediated transient expression of CaALDH1:smGFP in N. benthamiana epidermal cells. GFP fluorescence was visualized using a confocal laser scanning microscope 48h after agroinfiltration. Bars=50 µm. (This figure is available in colour at JXB online.)
Fig. 4.
Fig. 4.
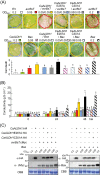
Transient CaALDH1 expression promotes avrBsT-triggered cell death, but not Bax-triggered cell death. (A) Cell-death phenotypes and quantification in N. benthamiana leaves 2 days after infiltration with Agrobacterium carrying CaALDH1, CaALDH1-E267A, CaALDH1-C301A, avrBsT or Bax at different inoculum ratios. Cell death was quantified based on a 0−3 scale: 0, no cell death (<10%); 1, weak cell death (10–30%); 2, partial cell death (30–80%); and 3, full cell death (80–100%). Data are means ±SD from three independent experiments. Different letters indicate statistically significant differences (LSD, P<0.05). (B) Electrolyte leakage from leaf discs at different time points after infiltration with Agrobacterium carrying the indicated constructs at different inoculum ratios. Data are means ±SD from three independent experiments. Different letters indicate statistically significant differences (LSD, P<0.05). (C) Immunoblot analyses of transient expression of CaALDH1, CaALDH1-E267A, CaALDH1-C301A, BAX and avrBs 2 days after agroinfiltration. Protein loading was visualized by Coomassie brilliant blue (CBB) staining. (This figure is available in colour at JXB online.)
Fig. 5.
Fig. 5.
Aldehyde dehydrogenase activity assay. (A) Coexpression of CaALDH1, CaALDH1-E267A, or CaALDH1-C301A with avrBsT. (B) Coexpression of CaALDH1, CaALDH1-E267A, or CaALDH1-C301A with Bax. N. benthamiana leaves were infiltrated with Agrobacterium carrying the indicated constructs at different inoculum ratios. ALDH activity in crude extracts was assayed at 0, 24 and 48h after agroinfiltration. RFU 460nm, relative fluorescence units at 460nm.
Fig. 6.
Fig. 6.
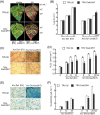
Enhanced susceptibility of CaALDH1-silenced pepper leaves to avirulent Ds1 (avrBsT) or virulent Ds1 (EV) Xcv infection. (A) Enhanced disease symptoms on CaALDH1-silenced pepper leaves. Yellow line, symptoms visible only under UV illumination; orange line, visible symptoms; red line, complete cell death. (B) Bacterial growth in leaves at 0, 1 and 3 days after Xcv infiltration. Xcv Ds1 (EV) and Ds1 (avrBsT) (5×10⁵ cfu ml-1) were infiltrated into empty-vector control (TRV:00) and CaALDH1-silenced (TRV:CaALDH1) leaves. (C) DAB staining and (D) quantification of H2O2 at different time points after infiltration with Xcv Ds1 (EV) and Ds1 (avrBsT) (5×10⁷ cfu ml-1). (E) Trypan blue staining and (F) electrolyte leakage from leaves infiltrated with Xcv Ds1 (EV) and Ds1 (avrBsT) (5×10⁷ cfu ml-1). Trypan blue staining was performed 24h after infiltration. Asterisks indicate statistically significant differences (t-test; P<0.05). Data are mean values ±SD from three independent experiments with four replicates each. EV, empty vector. (This figure is available in colour at JXB online.)
Fig. 7.
Fig. 7.
Decreased aldehyde dehydrogenase activity in CaALDH1-silenced pepper leaves infiltrated with Xcv Ds1 (EV) and Ds1 (avrBsT) (5×10⁵ cfu ml-1). ALDH activity in pepper leaf crude extracts was analysed at different time points after Xcv infiltration. Asterisks indicate statistically significant differences (t-test; P<0.05). Data are mean values ±SD from three independent experiments. RFU 460nm, relative fluorescence units at 460nm; EV, empty vector.
Fig. 8.
Fig. 8.
Quantitative real-time RT-PCR analysis of defence-related gene expression in empty-vector control (TRV:00) and CaALDH1-silenced (TRV:CaALDH1) pepper leaves infiltrated with Xcv Ds1 (EV) and Ds1 (avrBsT) (5×10⁷ cfu ml-1). CaPR1, PR1; CaPR10, PR10; CaDEF1, defensin1. Expression levels of Capsicum annuum CaACTIN were used to normalize defence-related gene expression levels. Asterisks indicate statistically significant differences (t-test; P<0.05). Data are mean values ±SD from three independent experiments. EV, empty vector.
Fig. 9.
Fig. 9.
Enhanced resistance of CaALDH1-overexpressing Arabidopsis plants to Pst DC3000 and DC3000 (avrRpm1). (A) Bacterial growth in leaves of wild-type and CaALDH1-overexpressing plants at 0, 1 and 3 days after inoculation (5×10⁵ cfu ml-1). (B) H2O2 quantification at different time points after inoculation (5×10⁷ cfu ml-1). (C) Electrolyte leakage measurement. Wild-type and CaALDH1-overexpressing leaves were infiltrated with Pst DC3000 and DC3000 (avrRpm1) (5×10⁷ cfu ml-1), and electrolyte leakage was monitored at the indicated time points. Data are mean values ±SD from three independent experiments with four replicates each. Different letters indicate significant differences at different time points (Fisher’s least significant differences; P<0.05).
Fig. 10.
Fig. 10.
Enhanced aldehyde dehydrogenase activity in leaves of CaALDH1-overexpressing Arabidopsis lines in response to Pst DC3000 and DC3000 (avrRpm1) (5×10⁷ cfu ml-1) infection. ALDH activity in pepper leaf crude extracts was analysed at the indicated time points after infiltration with Pst. RFU 460nm, relative fluorescence units at 460nm.
Fig. 11.
Fig. 11.
Enhanced resistance of CaALDH1-overexpressing Arabidopsis plants to Hpa Noco2 infection. (A) Disease symptoms on cotyledons of wild-type and CaALDH1-overexpressing plants 7 days after inoculation with Hpa Noco2. (B) Number of sporangiophores per cotyledon of wild-type and CaALDH1-overexpressing plants at 5 days after inoculation. Data were quantified based on the number of sporangiophores counted per cotyledon as follows: 0, no sporulation; 1−9, light sporulation; 10−19, medium sporulation; ≥20, heavy sporulation. More than 50 cotyledons of wild-type and CaALDH1-overexpressing plant lines were counted. Average numbers of sporangiophores are given below the chart. Data represent mean values ±SD from three independent experiments. Different letters indicate statistically significant differences (LSD, P<0.05). (This figure is available in colour at JXB online.)

Similar articles

Cited by

References

    1. Arnoult D, Gaume B, Karbowski M, Sharpe JC, Cecconi F, Youle RJ. 2003. Mitochondrial release of AIF and EndoG requires caspase activation downstream of Bax/Bak-mediated permeabilization. The EMBO Journal 22, 4385–4399. - PMC - PubMed
    1. Block A, Alfano JR. 2011. Plant targets for Pseudomonas syringae type III effectors: virulence targets or guarded decoys? Current Opinion in Microbiology 14, 39–46. - PMC - PubMed
    1. Bozhkov PV, Lam E. 2011. Green death: revealing programmed cell death in plants. Cell Death & Differentiation 18, 1239–1240. - PMC - PubMed
    1. Chen TH, Murata N. 2002. Enhancement of tolerance of abiotic stress by metabolic engineering of betaines and other compatible solutes. Current Opinion in Plant Biology 5, 250–257. - PubMed
    1. Chen XB, Zeng Q, Wood AJ. 2002. The stress-responsive Tortula ruralis gene ALDH21A1 describes a novel eukaryotic aldehyde dehydrogenase protein family. Journal of Plant Physiology 159, 677–684.

Publication types

MeSH terms