. 2015 Mar 31:9:110.
doi: 10.3389/fncel.2015.00110. eCollection 2015.

Changes in the regulation of the Notch signaling pathway are temporally correlated with regenerative failure in the mouse cochlea

Affiliations

Changes in the regulation of the Notch signaling pathway are temporally correlated with regenerative failure in the mouse cochlea

Juan C Maass et al. Front Cell Neurosci. .

Abstract

Sensorineural hearing loss is most commonly caused by the death of hair cells in the organ of Corti, and once lost, mammalian hair cells do not regenerate. In contrast, other vertebrates such as birds can regenerate hair cells by stimulating division and differentiation of neighboring supporting cells. We currently know little of the genetic networks which become active in supporting cells when hair cells die and that are activated in experimental models of hair cell regeneration. Several studies have shown that neonatal mammalian cochlear supporting cells are able to trans-differentiate into hair cells when cultured in conditions in which the Notch signaling pathway is blocked. We now show that the ability of cochlear supporting cells to trans-differentiate declines precipitously after birth, such that supporting cells from six-day-old mouse cochlea are entirely unresponsive to a blockade of the Notch pathway. We show that this trend is seen regardless of whether the Notch pathway is blocked with gamma secretase inhibitors, or by antibodies against the Notch1 receptor, suggesting that the action of gamma secretase inhibitors on neonatal supporting cells is likely to be by inhibiting Notch receptor cleavage. The loss of responsiveness to inhibition of the Notch pathway in the first postnatal week is due in part to a down-regulation of Notch receptors and ligands, and we show that this down-regulation persists in the adult animal, even under conditions of noise damage. Our data suggest that the Notch pathway is used to establish the repeating pattern of hair cells and supporting cells in the organ of Corti, but is not required to maintain this cellular mosaic once the production of hair cells and supporting cells is completed. Our results have implications for the proposed used of Notch pathway inhibitors in hearing restoration therapies.

Keywords: cochlea; hair cell; notch; regeneration; supporting cell.


Figures

Figure 1
Figure 1
Dose response of Notch inhibition in P0 cultures. (A) Immunostaining of apical portions of cochlear explants of newborn (P0) Atoh1A1GFP/A1GFP knock-in mice cultured 2 days in vitro (DIV) in DAPT from 0.75 to 10 μM or vehicle (DMSO). Atoh1: green. Myo7a: red. Scale 50 μm. (B) Quantitation of the increase in number of Myosin VIIa-labeled cells after different doses of DAPT compared to DMSO vehicle (same as shown in A). N = 4. *p = 0.030 (Mann-Whitney pairwise comparisons). Error bars: SEM. (C) mRNA amount of hair cell, supporting cell and Notch pathway genes obtained by QPCR in whole cochlear explants from P0 Atoh1GFP transgenic reporter mice treated with DAPT compared to DMSO vehicle. N = 3. Error bars: SEM. Note that error bars are present for each condition but are very small in some cases.
Figure 2
Figure 2
Position-dependent effect of Notch inhibition in P0 cultures. (A) Immunostaining of different cochlear portions from newborn (P0) Atoh1A1GFP/A1GFP knock-in mice (shown in C) treated with 10 μM DAPT or vehicle (DMSO) for 1 h to 3 days in vitro (DIV). Atoh1: green. Myo7a: red. DAPI: Blue. (B) Percentage of increase in numbers of Myosin VIIa-labeled cells and GFP-labeled cells in the different regions of the cochlea after DAPT 10 μM treatment compared to vehicle (same as shown in A). N = 4. *p = 0.030 (Mann-Whitney pairwise comparisons). Error bars: SEM. (C) Schematic view of the cochlear portions evaluated in (A,B).
Figure 3
Figure 3
Age-dependent decline in the effect of Notch inhibition on supporting cells in the presence of gamma secretase inhibitors or Notch1 blocking antibodies. (A) Immunostaining of apical portions of cochlear explants obtained at 0, 3 and 6 postnatal days (P0, P3 and P6) from Atoh1GFP transgenic reporter mice treated with 5 μM DAPT, 2 μg/ml Notch1 antibodies (Anti Notch1), 2 μg/ml control IgD and DMSO cultured 2 days in vitro (DIV). Myo7a: red. Scale 50 μm. (B) The increase in numbers of Myosin VIIa-labeled cells in the apical portion of the cochleas shown in (A). N = 6, 6 and 3 for P0, P3 and P6 respectively. *p = 0.0044 and 0.0045 for DMSO/DAPT and Anti Notch1/Control IgD comparisons respectively (Mann Whitney). Error bars: SEM. (C) mRNA amount of Notch pathway genes obtained by QPCR in whole cochlear explants of Atoh1GFP transgenic reporter P0 newborn mice cultured in the presence of DAPT or DMSO and in Notch1 antibodies or control IgD antibodies. Blue columns (top): level of expression after DAPT treatment relative to DMSO. Red columns (bottom): level of expression after anti Notch1 antibodies (aN1) relative to control IgD antibodies. N = 3. Error bars: SEM. Note that error bars are present for each condition but are very small in some cases.
Figure 4
Figure 4
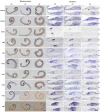
Notch pathway components are down-regulated during the first postnatal week. In situ hybridization of Notch pathway genes in the cochlea at 0, 3 and 6 postnatal days (P0, P3 and P6). Left panels: Whole mount in situs of cochlear explants, with the samples curved clockwise from apex to base. Scale = 200 μm. Right panels: In situ hybridization of frozen sections; a: apex region, b: basal region. Scale 50 μm.
Figure 5
Figure 5
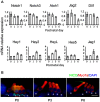
Notch pathway components and Notch1 signaling activity decline during the first postnatal week. (A) Relative expression of some Notch pathway genes obtained by QPCR from whole cochlear explants at 1, 3 and 6 postnatal days relative to newborn (0 postnatal days). N = 3. Error bars: SEM. Note that error bars are present for each condition but are very small in some cases. (B) Notch1 intracellular domain (NICD) immunostaining in cochlear sections of ICR newborn mice, obtained at 0, 3 and 6 postnatal days (P0, P3 and P6 respectively). NICD: green. Myo7a: red. DAPI: blue. Arrow heads: supporting cells positive for NICD staining. Stars: same supporting cells pointed by arrow heads but negative for NICD staining. Scale = 20 μm.
Figure 6
Figure 6
Comparison of Notch pathway genes in P1 and P21 cochlea at the single cell level. Pillar and Deiters’ cells were purified from P2 and P21 FGFR3-CreER;ROSA-TdTomato mice and RNA extracted from 162 (P2) and 123 (P21) single cells and subjected to QPCR analysis using the Fluidigm system (Durruthy-Durruthy et al., 2014) with primers for housekeeping genes and Notch pathway genes. (A) Graph showing the percentage of cells at each age that expressed detectable levels of each gene under analysis. (B) Violin plot showing the distribution of expression levels for each gene in all cells including the cells with no expression (Log2x = 0) presented in a combination of box plots and kernel density plots. White Crosses indicate the mean, white boxes the median expression levels. (C) Violin plot similar to (B), excluding cells with undetectable levels of expression for each gene.
Figure 7
Figure 7
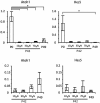
Hes5 and Atoh1 remain expressed at very low levels in the mature organ of Corti, even after noise damage. Relative expression of Atoh1 and Hes5 obtained by QPCR in cochlear explants from neonatal (P0) and 6 to 7 week old mice exposed to noise. The mice exposed to noise on the 42nd postnatal day (P42) were evaluated after 1 (1DaN), 3 (3DaN), or 7 (7DaN), days. As controls for the 7 day cohort we used 7 week old mice (P49) that had never been exposed to noise. The expression levels of Atoh1 and Hes5 were normalized to the level of expression at P0. N = 3 in all cases except P0, where N = 6. The values for adult animals are re-plotted on separate graphs; note that no significant changes occur in the adult samples. Error bars: SEM. *p = 0.03689 (Mann-Whitney pairwise comparisons).

References

    1. Abelló G., Khatri S., Giráldez F., Alsina B. (2007). Early regionalization of the otic placode and its regulation by the Notch signaling pathway. Mech. Dev. 124, 631–645. 10.1016/j.mod.2007.04.002 - DOI - PubMed
    1. Adam J., Myat A., Le Roux I., Eddison M., Henrique D., Ish-Horowicz D., et al. . (1998). Cell fate choices and the expression of Notch, Delta and Serrate homologues in the chick inner ear: parallels with Drosophila sense-organ development. Development 125, 4645–4654. - PubMed
    1. Artavanis-Tsakonas S., Muskavitch M. A. (2010). Notch: the past, the present and the future. Curr. Top. Dev. Biol. 92, 1–29. 10.1016/s0070-2153(10)92001-2 - DOI - PubMed
    1. Artavanis-Tsakonas S., Rand M. D., Lake R. J. (1999). Notch signaling: cell fate control and signal integration in development. Science 284, 770–776. 10.1126/science.284.5415.770 - DOI - PubMed
    1. Basch M. L., Ohyama T., Segil N., Groves A. K. (2011). Canonical Notch signaling is not necessary for prosensory induction in the mouse cochlea: insights from a conditional mutant of RBPjkappa. J. Neurosci. 31, 8046–8058. 10.1523/jneurosci.6671-10.2011 - DOI - PMC - PubMed

LinkOut - more resources