. 2015 Feb 2;7(1):21.
doi: 10.1186/s13073-015-0135-5. eCollection 2015.

Integrated analysis reveals microRNA networks coordinately expressed with key proteins in breast cancer

Affiliations

Integrated analysis reveals microRNA networks coordinately expressed with key proteins in breast cancer

Miriam Ragle Aure et al. Genome Med. .

Abstract

Background: The role played by microRNAs in the deregulation of protein expression in breast cancer is only partly understood. To gain insight, the combined effect of microRNA and mRNA expression on protein expression was investigated in three independent data sets.

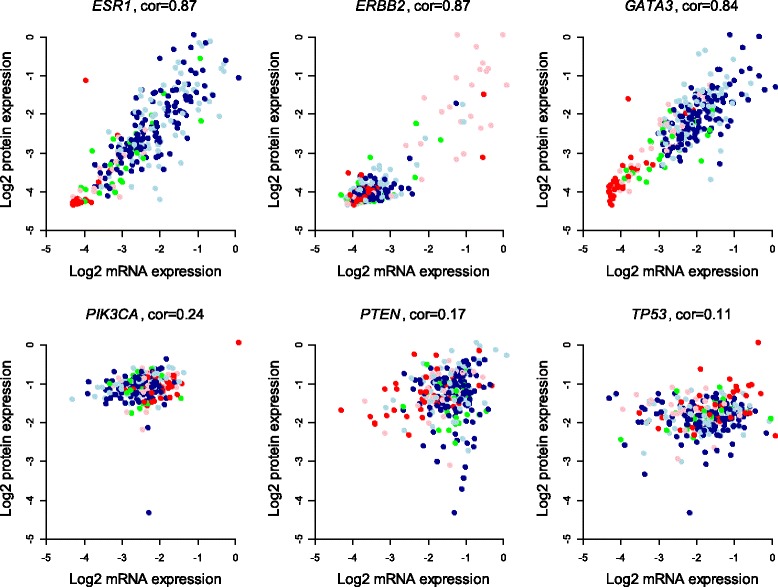
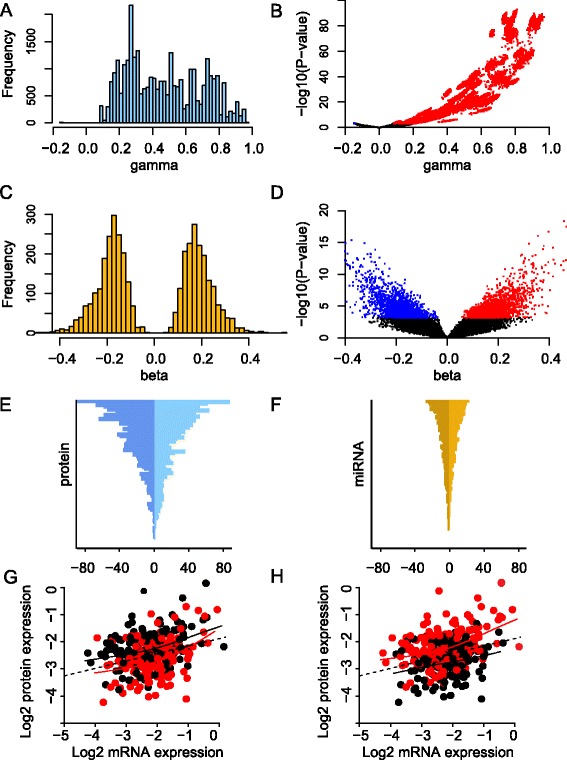
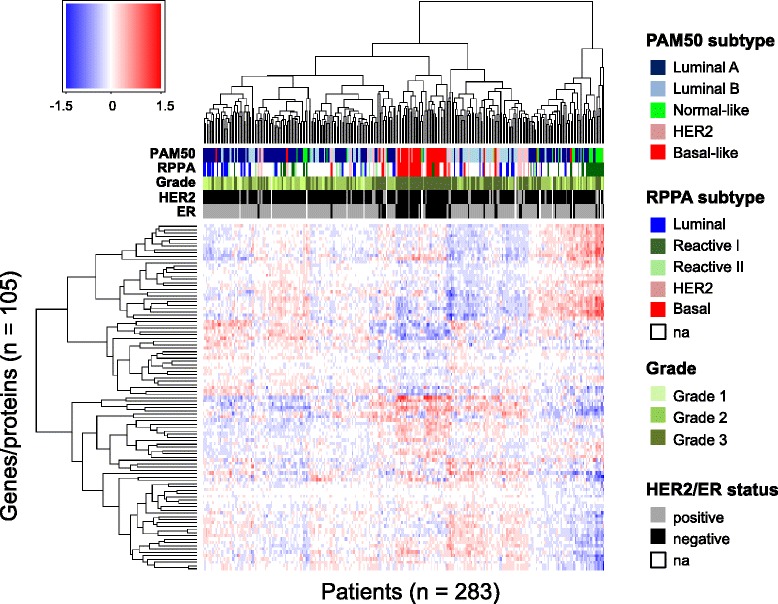
Methods: Protein expression was modeled as a multilinear function of powers of mRNA and microRNA expression. The model was first applied to mRNA and protein expression for 105 selected cancer-associated genes and to genome-wide microRNA expression from 283 breast tumors. The model considered both the effect of one microRNA at a time and all microRNAs combined. In the latter case the Lasso penalized regression method was applied to detect the simultaneous effect of multiple microRNAs.

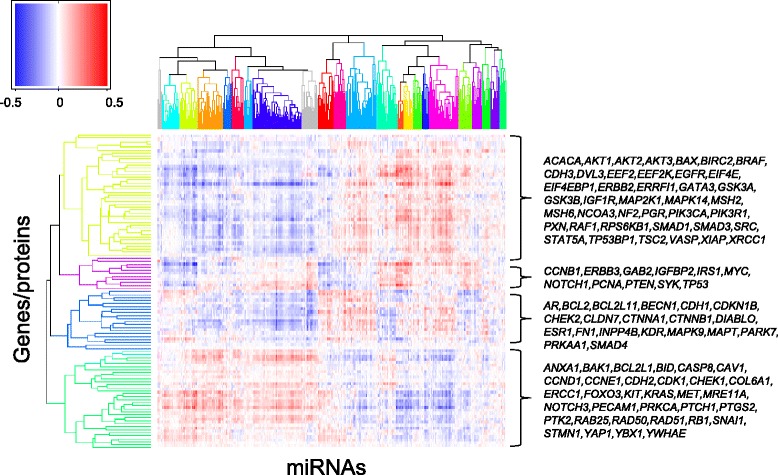
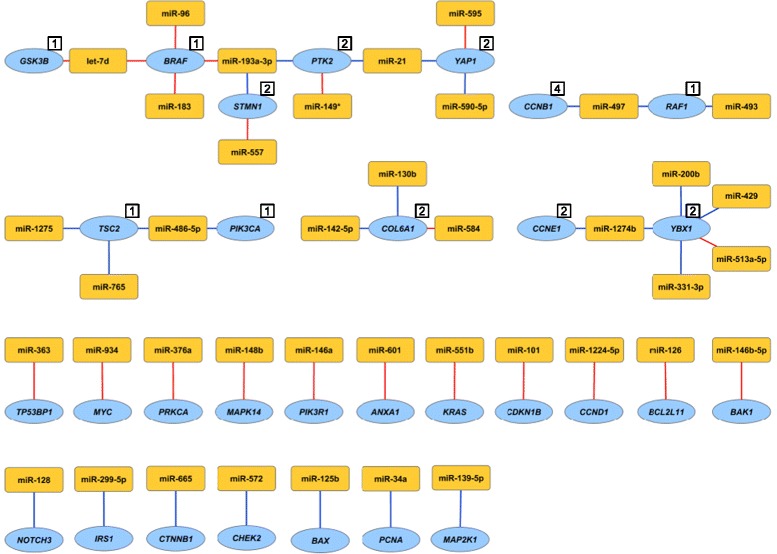
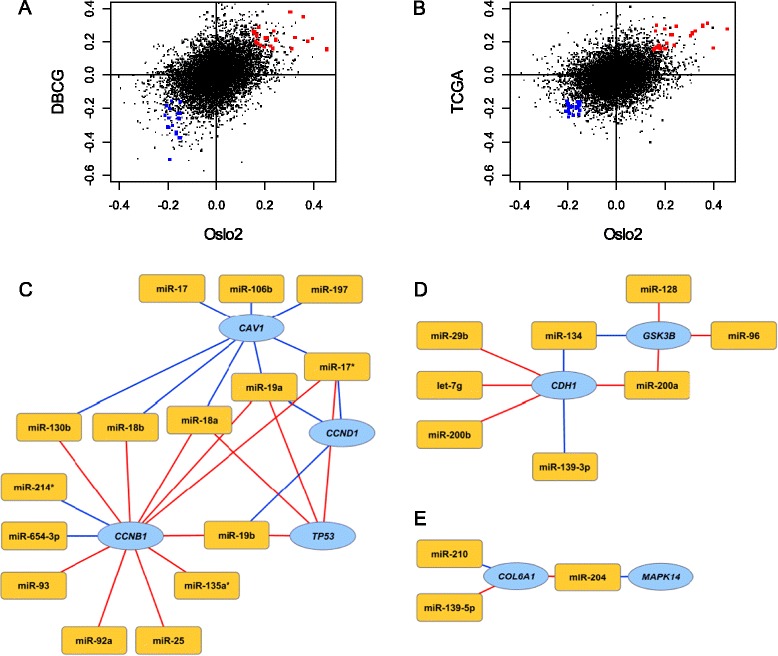
Results: An interactome map for breast cancer representing all direct and indirect associations between the expression of microRNAs and proteins was derived. A pattern of extensive coordination between microRNA and protein expression in breast cancer emerges, with multiple clusters of microRNAs being associated with multiple clusters of proteins. Results were subsequently validated in two independent breast cancer data sets. A number of the microRNA-protein associations were functionally validated in a breast cancer cell line.

Conclusions: A comprehensive map is derived for the co-expression in breast cancer of microRNAs and 105 proteins with known roles in cancer, after filtering out the in-cis effect of mRNA expression. The analysis suggests that group action by several microRNAs to deregulate the expression of proteins is a common modus operandi in breast cancer.


Figures

Figure 1
Figure 1
Relationships between mRNA and protein for selected genes. Each dot represents a patient and the colors indicate PAM50 expression subtype (red, basal-like; pink, HER2-enriched; green, normal-like; dark blue, luminal A; light blue, luminal B). Pearson correlation between mRNA and protein expression is indicated above each plot.
Figure 2
Figure 2
Effect of mRNA and miRNA on protein expression. (A) The effect of mRNA on protein for all significant mRNA coefficients (‘gamma’). (B) Volcano plot showing all estimated mRNA coefficients (‘gamma’) plotted against corresponding P-values. Significant and negative associations are shown in blue and significant and positive associations are shown in red. (C) The effect of miRNA on protein for all significant miRNA coefficients (‘beta’). (D) Volcano plot showing all estimated miRNA coefficients (‘beta’) plotted against corresponding P-values. Coloring as in (B). (E) Number of miRNAs per protein. The horizontal axis represents the negative and positive number of associations with miRNAs, and the vertical axis represents the 105 proteins in descending order. (F) Number of proteins per miRNA. The horizontal axis represents the negative and positive number of associations with proteins, and the vertical axis represents the 421 miRNAs in descending order. (G) Example of a negative association between miRNA expression and protein expression. The horizontal axis represents BRAF mRNA expression and the vertical axis B-Raf protein expression (both on log2-scale). Each point represents a patient, and the color indicates whether the expression of miR-638 is above the median (red) or below the median (black). Solid lines represent smoothing splines fitted to the data. The dotted line represents a linear regression fit to the data. For any fixed level of mRNA expression, high expression of miR-638 is associated with decreased protein expression of B-Raf. (H) Example of a positive association between miRNA expression and protein expression. The horizontal and vertical axes are the same as in (G), but here each patient point is color-coded according to miR-107 expression (red, miR-107 expression above median; black, miR-107 expression below median). For any fixed level of mRNA expression, high expression of miR-107 is associated with increased B-Raf protein expression.
Figure 3
Figure 3
The miRNA-mRNA-protein interactome. The clustered heatmap represents all miRNA coefficients from the univariate model 3 with the 421 miRNAs shown as columns and the 105 gene/protein pairs shown as rows. Pearson correlation distance and complete linkage was used in the hierarchical clustering. The colors of the dendrograms represent the different clusters found by the PART algorithm [21]. The miRNAs form 23 unique clusters and the gene-protein pairs form four clusters. Genes/proteins residing in each cluster are indicated to the right in alphabetical order.
Figure 4
Figure 4
Patient-specific predicted effects of miRNA on protein. Rows represent the 105 genes/proteins and columns represent the 283 patients. The color bars under the dendrogram represent PAM50 and RPPA molecular subtypes (mRNA and protein based, respectively), histological grade, human epidermal growth factor receptor 2 (HER2) status, and estrogen receptor (ER) status. The colors in the heatmap represent the patient-specific effects of miRNA on protein and are numerical values obtained by multiplying each miRNA coefficient (from the multivariate analysis) with the corresponding miRNA expression, in a given patient, for a given protein. The clustering of the proteins and patients was performed using Euclidean distance and complete linkage. Na, not available.
Figure 5
Figure 5
miRNA-protein associations validated by cell line functional assessment. Individual miRNAs were overexpressed in the MDA-MB-231 breast cancer cell line and the effect on protein expression was assessed. Shown are miRNA-protein associations that were both estimated based on the Oslo2 patient data and confirmed with the in vitro cell line experiment. The numbers in the white boxes represent protein cluster number in cases where several proteins share miRNA associations. Red lines indicate positive associations and blue lines negative associations. Yellow nodes represent miRNAs and blue nodes represent genes/proteins. The figure was made using Cytoscape version 2.8.3 [28].
Figure 6
Figure 6
Comparison of miRNA-protein associations in three independent data sets. (A) Scatterplot representing the miRNA coefficients in model 3 estimated in the Oslo2 and DBCG data sets. (B) Scatterplot representing the beta values estimated in the Oslo2 and TCGA data sets. In (A) and (B), red points indicate miRNA-protein associations with a miRNA coefficient above 0.15 across all three data sets and blue points indicate miRNA-protein associations which have a miRNA coefficient below −0.15 across all three data sets. (C-E) miRNA-protein associations with miRNA coefficients exceeding 0.15 in absolute value in all three data sets. Red lines indicate positive associations and blue lines negative associations. Yellow nodes represent miRNAs and blue nodes represent proteins. Panels (C-E) were made using Cytoscape version 2.8.3 [28].

References

    1. Sass S, Dietmann S, Burk U, Brabletz S, Lutter D, Kowarsch A, et al. MicroRNAs coordinately regulate protein complexes. BMC Syst Biol. 2011;5:136. doi: 10.1186/1752-0509-5-136. - DOI - PMC - PubMed
    1. Enerly E, Steinfeld I, Kleivi K, Leivonen S-K, Aure MR, Russnes HG, et al. miRNA-mRNA integrated analysis reveals roles for miRNAs in primary breast tumors. PLoS One. 2011;6:e16915. doi: 10.1371/journal.pone.0016915. - DOI - PMC - PubMed
    1. Dvinge H, Git A, Graf S, Salmon-Divon M, Curtis C, Sottoriva A, et al. The shaping and functional consequences of the microRNA landscape in breast cancer. Nature. 2013;497:378–82. doi: 10.1038/nature12108. - DOI - PubMed
    1. Bartel DP. MicroRNAs: target recognition and regulatory functions. Cell. 2009;136:215–33. doi: 10.1016/j.cell.2009.01.002. - DOI - PMC - PubMed
    1. Place RF, Li L-C, Pookot D, Noonan EJ, Dahiya R. MicroRNA-373 induces expression of genes with complementary promoter sequences. Proc Natl Acad Sci U S A. 2008;105:1608–13. doi: 10.1073/pnas.0707594105. - DOI - PMC - PubMed