. 2015 Mar 26;7(1):34.
doi: 10.1186/s13148-015-0064-6. eCollection 2015.

Age-associated DNA methylation changes in immune genes, histone modifiers and chromatin remodeling factors within 5 years after birth in human blood leukocytes

Affiliations

Age-associated DNA methylation changes in immune genes, histone modifiers and chromatin remodeling factors within 5 years after birth in human blood leukocytes

Nathalie Acevedo et al. Clin Epigenetics. .

Abstract

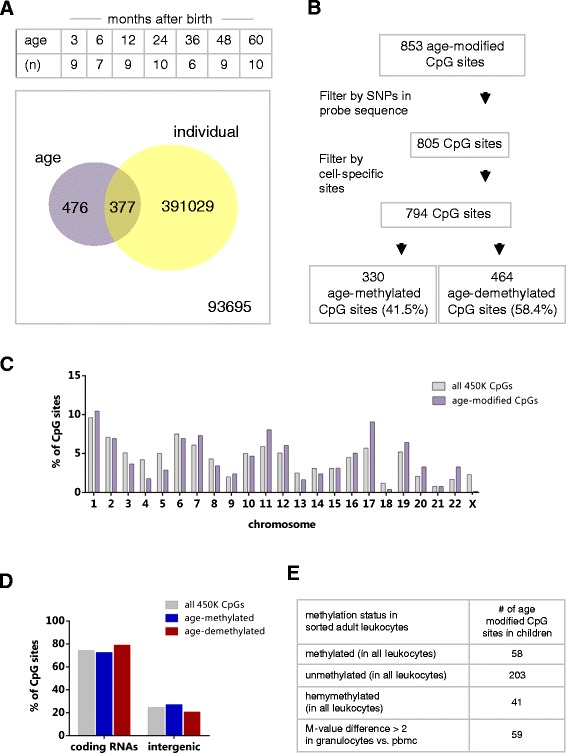
Background: Age-related changes in DNA methylation occurring in blood leukocytes during early childhood may reflect epigenetic maturation. We hypothesized that some of these changes involve gene networks of critical relevance in leukocyte biology and conducted a prospective study to elucidate the dynamics of DNA methylation. Serial blood samples were collected at 3, 6, 12, 24, 36, 48 and 60 months after birth in ten healthy girls born in Finland and participating in the Type 1 Diabetes Prediction and Prevention Study. DNA methylation was measured using the HumanMethylation450 BeadChip.

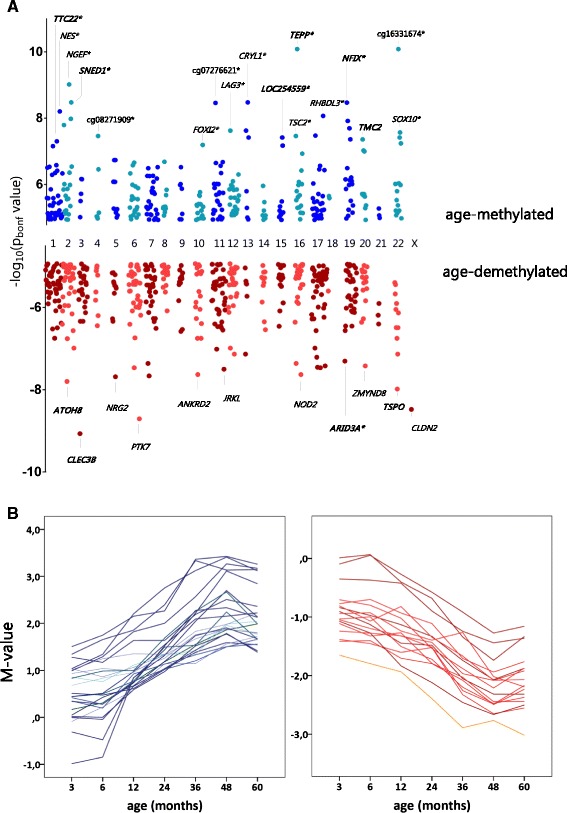
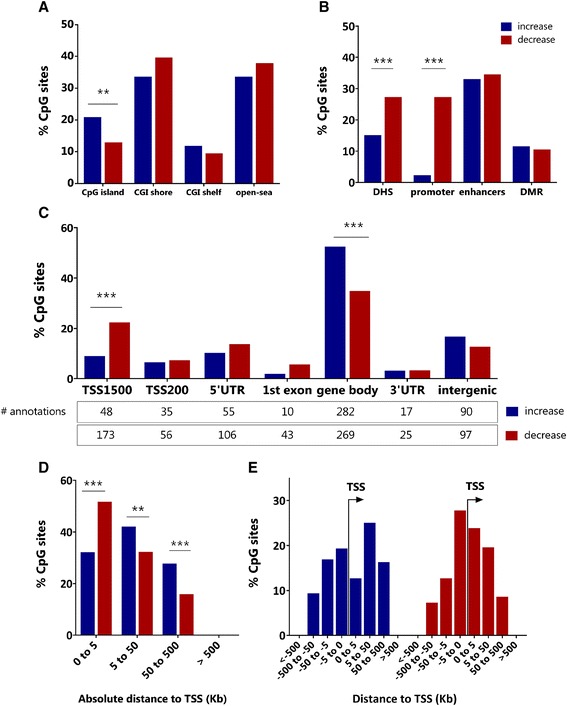
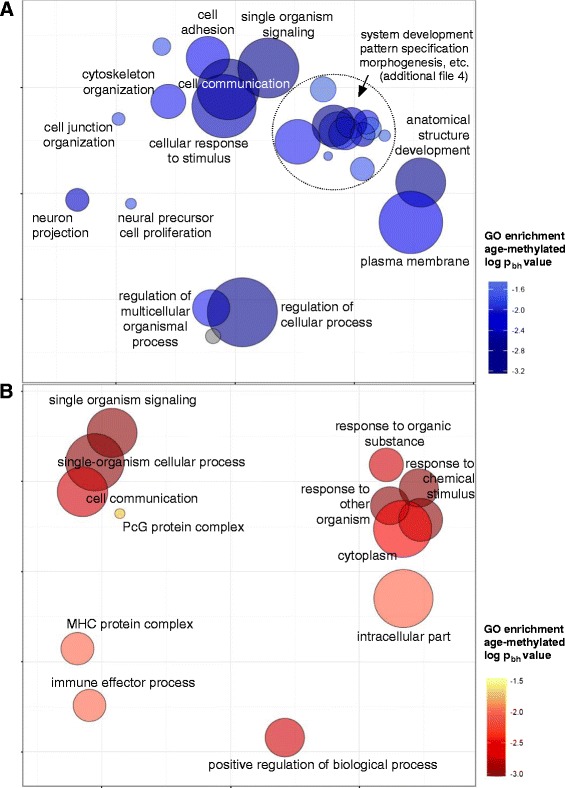
Results: After filtering for the presence of polymorphisms and cell-lineage-specific signatures, 794 CpG sites showed significant DNA methylation differences as a function of age in all children (41.6% age-methylated and 58.4% age-demethylated, Bonferroni-corrected P value <0.01). Age-methylated CpGs were more frequently located in gene bodies and within +5 to +50 kilobases (kb) of transcription start sites (TSS) and enriched in developmental, neuronal and plasma membrane genes. Age-demethylated CpGs were associated to promoters and DNAse-I hypersensitivity sites, located within -5 to +5 kb of the nearest TSS and enriched in genes related to immunity, antigen presentation, the polycomb-group protein complex and cytoplasm.

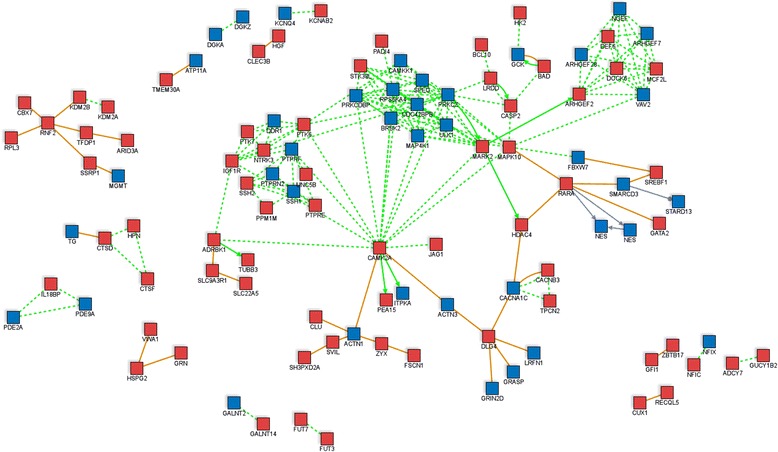
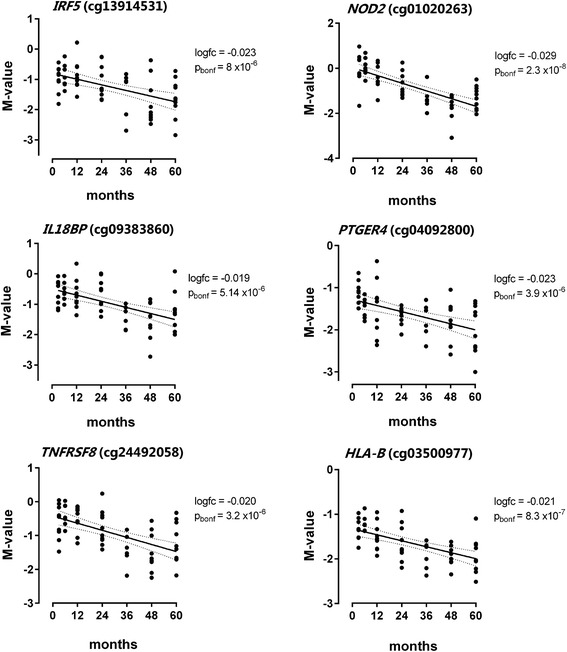
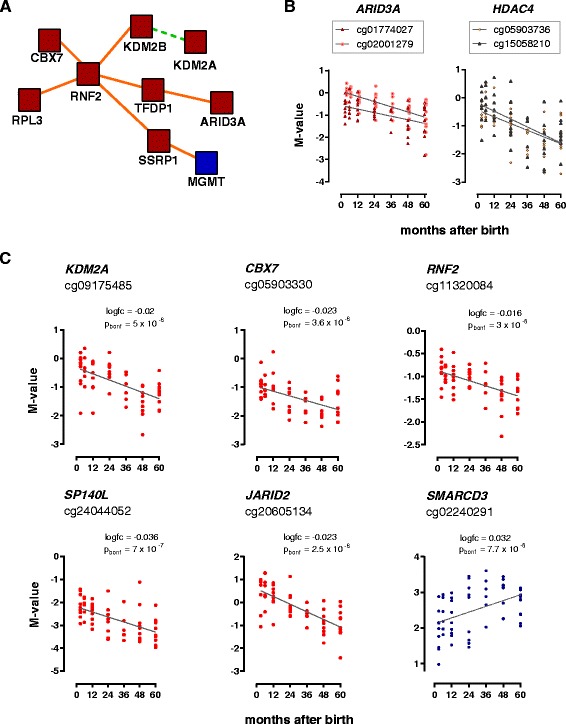
Conclusions: This study reveals that susceptibility loci for complex inflammatory diseases (for example, IRF5, NOD2, and PTGER4) and genes encoding histone modifiers and chromatin remodeling factors (for example, HDAC4, KDM2A, KDM2B, JARID2, ARID3A, and SMARCD3) undergo DNA methylation changes in leukocytes during early childhood. These results open new perspectives to understand leukocyte maturation and provide a catalogue of CpG sites that may need to be corrected for age effects when performing DNA methylation studies in children.

Keywords: Age-modified CpG; Childhood; DNA methylation; Genes; Leukocytes; Longitudinal.


Figures

Figure 1
Figure 1
Descriptive information of age-modified CpG sites. (A) Schema showing the time points analysed, number of samples (n) and the number of differentially methylated CpGs based on age and individual. (B) Filtering steps on the 853 age-modified CpGs. (C) Chromosomal distribution of age-modified CpGs in relation to the expected proportions according to the location of all probes in the 450 K assay. (D) Distribution of age-modified CpG sites within RNA coding regions or intergenic regions in relation to the expected proportions of all probes in the 450 K assay. (E) Number of age-modified CpG sites that were found homogeneously methylated in seven populations of sorted blood leukocytes, granulocytes and peripheral blood mononuclear cells (PBMCs) from healthy adults as described in [34]. The list of age-modified CpG sites with homogeneous methylation in sorted leukocytes is presented in Additional file 1.
Figure 2
Figure 2
Chromosomal distribution and DNA methylation trends of the significant age-modified CpG sites. (A) Dot plot showing the chromosomal distribution of age-methylated CpGs (blue dots) and age-demethylated CpGs (red dots) in relation to the Bonferroni-corrected P value. For methylated genes: TTC22 = tetratricopeptide repeat domain 22; NES = nestin; NGEF = neuronal guanidine nucleotide exchange factor; SNED1 = sushi nidogen and EGF-like domains 1; FOXI2 = forkhead box I2; LAG3 = lymphocyte activation gene 3; CRYL1 = crystallin lambda 1; TEPP = testis prostate and placenta expressed; TSC2 = tuberous sclerosis 2; RHBDL3 = rhomboid, veinlet-like 3 (Drosophila); NFIX = nuclear factor I/X; TMC2: transmembrane channel-like 2; SOX10 = SRY-box 10. For demethylated genes: ATOH8 = atonal homolog 8; CLEC3B = C-type lectin domain family 3, member B, NRG2 = neuregulin 2; PTK7 = protein tyrosine kinase 7; ANKRD2 = ankyrin repeat domain 2; JRKL = JRK-like; NOD2 = nucleotide-binding oligomerization domain containing 2; ARID3A = AT-rich interactive domain 3A; ZMYND8 = zinc finger, MYND-type containing 8; TSPO = translocator protein (18 kDa); CLDN2 = claudin 2. An asterisk next to the gene symbol indicates that the age-modified CpG site has similar DNA methylation levels in sorted blood leukocytes of healthy adults. Genes in bold indicate that the annotated CpG site is embedded in an age-modified region. Detailed information on P values is presented in Additional file 1. (B) Time trends in DNA methylation (M value) for age-methylated sites (blue) and age-demethylated sites (red). M values above 1 represent that the site is methylated, and M values below −1 represent that the site is demethylated. A value of 0 is proportional to a beta value of 0.50. Each line represents a CpG site.
Figure 3
Figure 3
Differences in the genomic distribution of age-modified CpG sites. (A) Frequency of age-modified CpG sites according to the proximity to a CpG island (CGI). (B) Frequency of age-modified CpG sites according to regulatory annotations. (C) Frequency of age-modified CpG sites according to the gene location. TSS = transcriptional start site; UTR = untranslated region; age-methylated CpGs mapped to 537 gene locations and age-demethylated CpGs to 769 gene locations. (D) Frequency of age-modified CpG sites binned by absolute distance to the nearest TSS. (E) Frequency of age-modified CpG sites according to their location in relation to the nearest TSS (upstream/downstream).
Figure 4
Figure 4
Induced network analysis for the known protein-protein interactions between the products of genes containing age-modified CpG sites. Genes harbouring age-modified CpG sites were used as seeds to identify known protein-protein interactions (orange line), connections in a biochemical reaction (solid and dotted green lines) and genetic regulation (purple line) at high level of confidence. Node colour represents if the gene is age methylated (blue) or age demethylated (red). The solid arrow in a biochemical reaction (green) indicates protein/substrate relationship. Non-connected seed nodes are not shown.
Figure 5
Figure 5
Gene ontology (GO) categories significantly enriched in genes harbouring age-modified CpG sites. Summary of GO categories presented in a two-dimensional space derived by applying multidimensional scaling to a pairwise distance matrix of the semantic similarities in GO terms. (A) Enriched GO categories in age-methylated CpG sites (blue); (B) Enriched GO categories in age-demethylated sites (red); colour scales represent the Benjamini-Hochberg corrected log P value for the enrichment (log P −2 equals P = 0.01). Circle sizes indicate the number of genes of each GO term (set size). Detailed information on enriched GO categories, number of age-modified loci per GO term and P values is presented in Additional file 3 (for age-methylated CpGs) and Additional file 4 (for age-demethylated CpGs). For this visualization approach, highly similar GO categories are grouped together and cluster representatives are selected based on P values and dispensability scores. Each GO term receives a coordinate so that more semantically similar GO terms get closer in the plot [58]. To be regarded as significant, any GO term requires coincidence of at least five genes and a pbh = 0.05.
Figure 6
Figure 6
Longitudinal trends of the DNA methylation levels in six immune genes within 3 to 60 months after birth. DNA methylation levels are expressed as M value; each dot represents an individual. The dotted lines represent the 95% CI of the regression line; logfc = log fold change in methylation over time; pbonf = Bonferroni-corrected P value. IRF5 = interferon regulatory factor 5; NOD2 = nucleotide-binding oligomerization domain containing 2; IL18BP = interleukin 18 binding protein; PTGER4 = prostaglandin E receptor 4; TNFRSF8 = tumour necrosis factor receptor superfamily, member 8; HLA-B = major histocompatibility complex, class I, B.
Figure 7
Figure 7
DNA methylation levels within 3 to 60 months after birth in genes encoding histone modifiers and chromatin remodelers. (A) Protein interactions among genes related to the chromatin remodelling machinery that contain age-modified CpG sites; protein-protein interaction (orange line); biochemical reaction (green line); factors encoded by age-demethylated genes (red) and age-methylated genes (blue). (B) Longitudinal changes in DNA methylation for two CpG sites in the genes encoding for AT-rich interactive domain-containing protein 3A (ARID3A) and the histone deacetylase 4 (HDAC4); each dot represents an individual. (C) Longitudinal changes in DNA methylation for six genes involved in the chromatin remodelling; each dot represents an individual. KDM2A = lysine (K)-specific demethylase 2A; CBX7 = chromobox homolog 7; RNF2 = E3 ubiquitin-protein ligase RING2; SP140L = SP140 nuclear body protein-like; JARID2 = jumonji, AT-rich interactive domain 2; SMARCD3 = SWI/SNF-related, matrix-associated, actin-dependent regulator of chromatin, subfamily d, member 3.
Figure 8
Figure 8
mRNA levels of genes harbouring age-modified CpG sites based on the FANTOM5 consortium data. (A) CAGE-defined TSS expression profiles for the age-methylated genes NGEF, SEPT5 and PDE2A in purified primary leukocytes and brain tissues. (B) CAGE-defined TSS expression profiles for the age-demethylated genes PTGER4 and PRDM16 and the age-methylated gene SNED1; mRNA levels are presented in transcripts per million (TPM, y-axis). Forty-five samples from blood and neuronal lineages as evaluated by the FANTOM5 consortium [43] are represented in the x-axis. Detailed information on the samples included in this comparison is presented in Additional file 8.

References

    1. Nagae G, Isagawa T, Shiraki N, Fujita T, Yamamoto S, Tsutsumi S, et al. Tissue-specific demethylation in CpG-poor promoters during cellular differentiation. Hum Mol Genet. 2011;20:2710–21. doi: 10.1093/hmg/ddr170. - DOI - PubMed
    1. Ji H, Ehrlich LI, Seita J, Murakami P, Doi A, Lindau P, et al. Comprehensive methylome map of lineage commitment from haematopoietic progenitors. Nature. 2010;467:338–42. doi: 10.1038/nature09367. - DOI - PMC - PubMed
    1. Chen ZX, Riggs AD. DNA methylation and demethylation in mammals. J Biol Chem. 2011;286:18347–53. doi: 10.1074/jbc.R110.205286. - DOI - PMC - PubMed
    1. Kohli RM, Zhang Y. TET enzymes, TDG and the dynamics of DNA demethylation. Nature. 2013;502:472–9. doi: 10.1038/nature12750. - DOI - PMC - PubMed
    1. Martinowich K, Hattori D, Wu H, Fouse S, He F, Hu Y, et al. DNA methylation-related chromatin remodeling in activity-dependent BDNF gene regulation. Science. 2003;302:890–3. doi: 10.1126/science.1090842. - DOI - PubMed