

Niche suitability affects development: skull asymmetry increases in less suitable areas
- PMID: 25874364
- PMCID: PMC4398368
- DOI: 10.1371/journal.pone.0122412
Niche suitability affects development: skull asymmetry increases in less suitable areas
Abstract
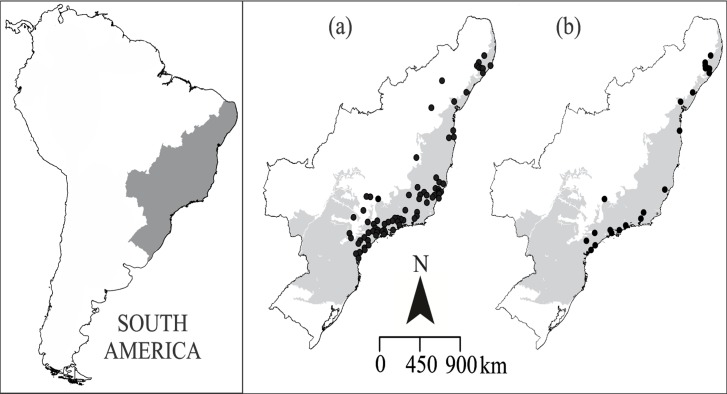
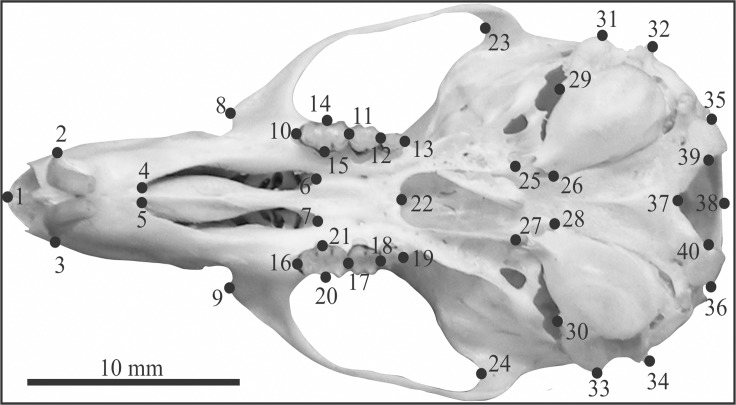
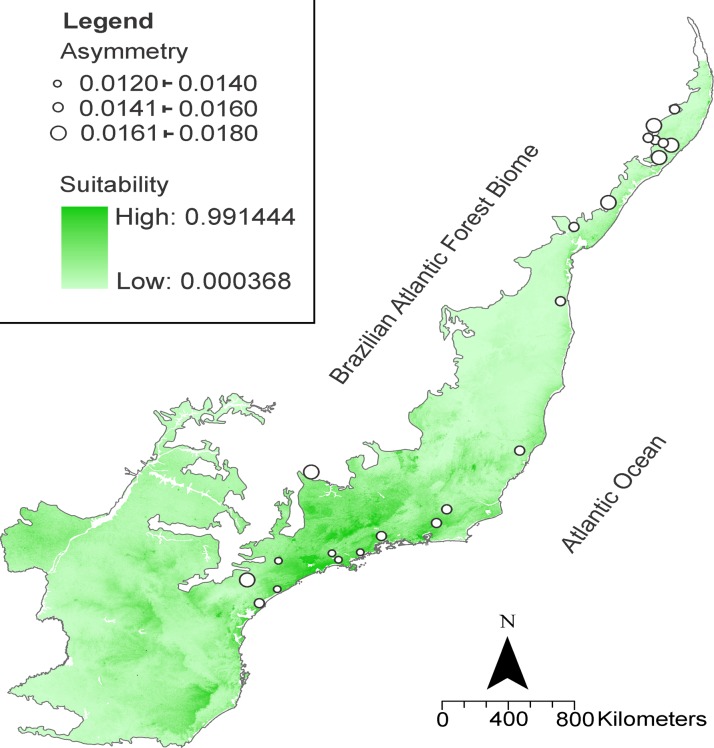
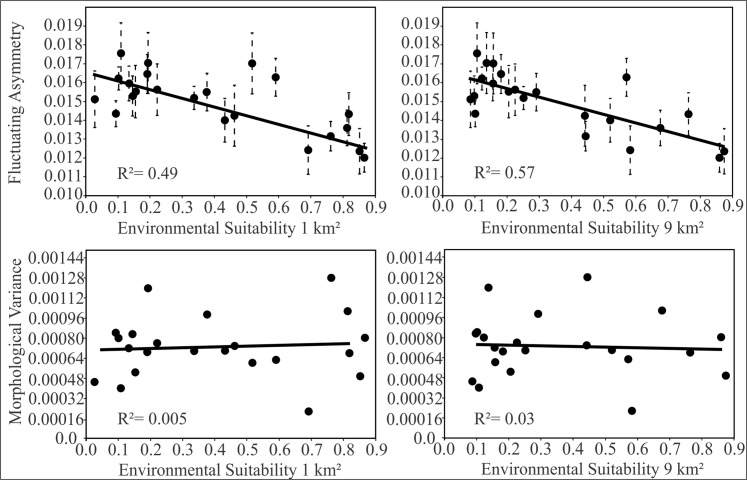
For conservation purposes, it is important to take into account the suitability of a species to particular habitats; this information may predict the long-term survival of a species. In this sense, morphological measures of developmental stress, such as fluctuating asymmetry, can be proxies for an individual's performance in different regions. In this study, we conducted tests to determine whether areas with different levels of suitability for a species (generated by ecological niche models) were congruent with morphological markers that reflect environmental stress and morphological variance. We generated a Maxent niche model and compared the suitability assessments of several areas with the skull morphology data (fluctuating asymmetry and morphological disparity) of populations of the Atlantic forest endemic to Brazil rodent Akodon cursor. Our analyses showed a significant negative relationship between suitability levels and fluctuating asymmetry levels, which indicates that in less suitable areas, the individuals experience numerous disturbances during skull ontogeny. We have not found an association between morphological variance and environmental suitability. As expected, these results suggest that in environments with a lower suitability, developmental stress is increased. Such information is helpful in the understanding of the species evolution and in the selection of priority areas for the conservation of species.
Conflict of interest statement
Figures
References
-
- Ribeiro MC, Metzger JP, Martensen AC, Ponzoni FJ, Hirota MM (2009) The Brazilian Atlantic Forest: How much is left, and how is the remaining forest distributed? Implications for conservation. Biological Conservation 129: 1141–1553.
-
- Maiorano L, Falcucci A, Boitani L (2006) Gap analysis of terrestrial vertebrates in Italy: Priorities for conservation planning in a human dominated landscape. Biological Conservation 133: 455–473.
-
- Nori J, Lescano JN, Illoidi-Rangel P, Frutos N, Cabrera MR, Leynaud GC (2013) The conflict between agricultural expansion and priority conservation areas: Making the right decisions before it is too late. Biological Conservation 159: 507–513.
-
- Gkaraveli A, Good JEG, Willians JH (2004) Determining priority areas for native woodland expansion and restoration in Snowdonia National Park, Wales. Biological Conservation 115: 395–402.
-
- Butler DW (2009) Planning iterative investment for landscape restoration: Choice of biodiversity indicator makes a difference. Biological Conservation 142: 2202–2216.
Publication types
MeSH terms
LinkOut - more resources
Full Text Sources
Other Literature Sources
Research Materials
