. 2015 Apr 13;10(4):e0123643.
doi: 10.1371/journal.pone.0123643. eCollection 2015.

A critical period for postnatal adaptive plasticity in a model of motor axon miswiring

Affiliations

A critical period for postnatal adaptive plasticity in a model of motor axon miswiring

Michaela S Helmbrecht et al. PLoS One. .

Abstract

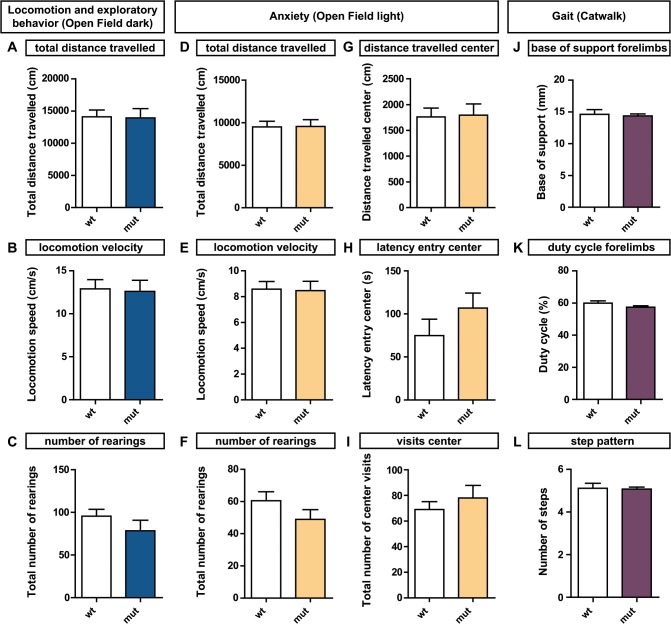
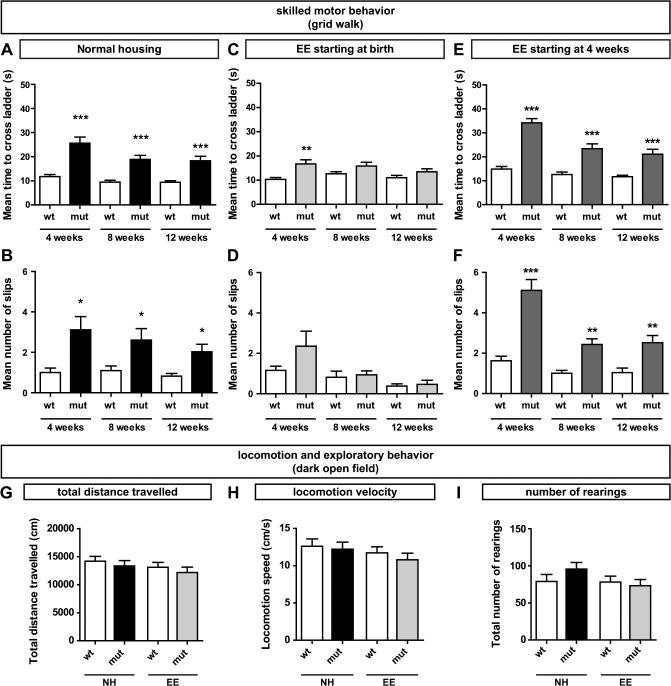
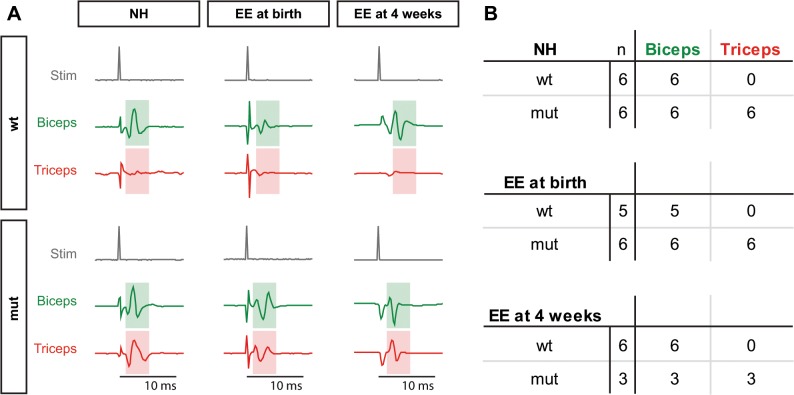
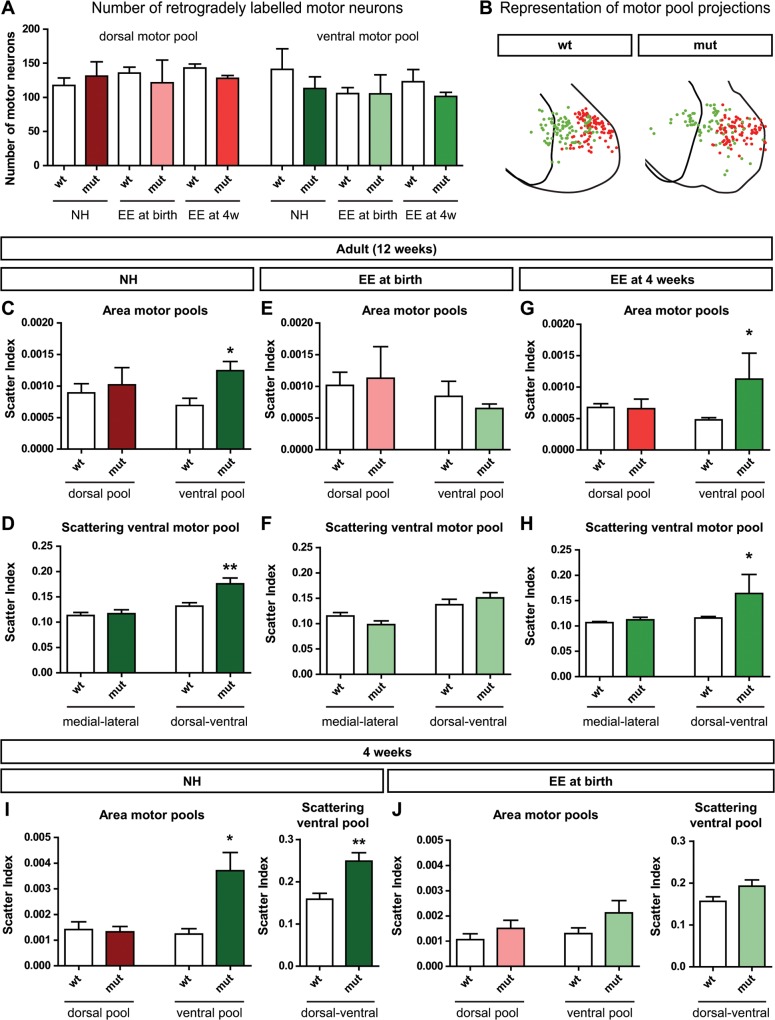
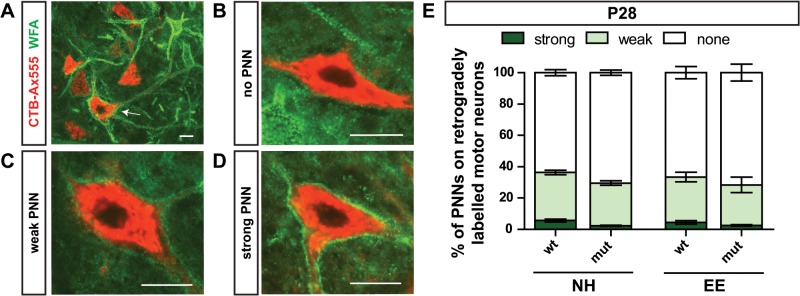
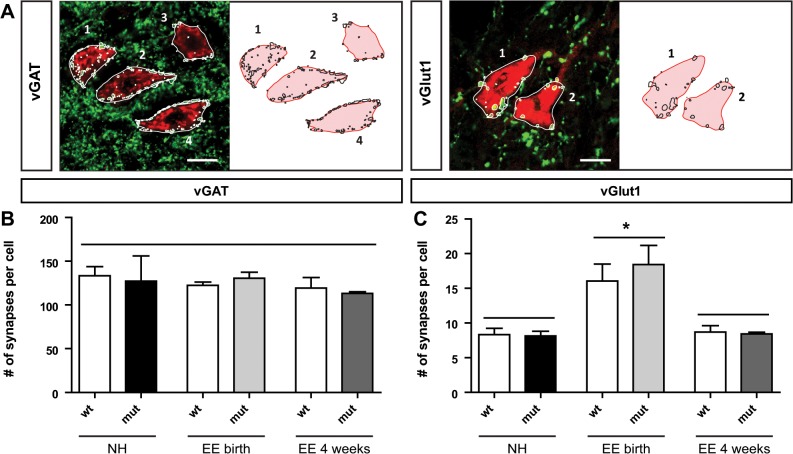
The correct wiring of neuronal circuits is of crucial importance for precise neuromuscular functionality. Therefore, guidance cues provide tight spatiotemporal control of axon growth and guidance. Mice lacking the guidance cue Semaphorin 3F (Sema3F) display very specific axon wiring deficits of motor neurons in the medial aspect of the lateral motor column (LMCm). While these deficits have been investigated extensively during embryonic development, it remained unclear how Sema3F mutant mice cope with these errors postnatally. We therefore investigated whether these animals provide a suitable model for the exploration of adaptive plasticity in a system of miswired neuronal circuitry. We show that the embryonically developed wiring deficits in Sema3F mutants persist until adulthood. As a consequence, these mutants display impairments in motor coordination that improve during normal postnatal development, but never reach wildtype levels. These improvements in motor coordination were boosted to wildtype levels by housing the animals in an enriched environment starting at birth. In contrast, a delayed start of enriched environment housing, at 4 weeks after birth, did not similarly affect motor performance of Sema3F mutants. These results, which are corroborated by neuroanatomical analyses, suggest a critical period for adaptive plasticity in neuromuscular circuitry. Interestingly, the formation of perineuronal nets, which are known to close the critical period for plastic changes in other systems, was not altered between the different housing groups. However, we found significant changes in the number of excitatory synapses on limb innervating motor neurons. Thus, we propose that during the early postnatal phase, when perineuronal nets have not yet been formed around spinal motor neurons, housing in enriched environment conditions induces adaptive plasticity in the motor system by the formation of additional synaptic contacts, in order to compensate for coordination deficits.


Conflict of interest statement

Competing Interests: The authors have declared that no competing interests exist.

Figures

Fig 1
Fig 1. Sema3F mutants show normal behavior in the dark and light open field test.
(A-C) Gross locomotion and exploratory behavior of Sema3F animals is analyzed at the age of 4 weeks in the dark open field. No significant differences are evident in (A) the total distance travelled (14100 ± 1069 cm vs. 13920 ± 1457 cm, p = 0.48), (B) the locomotion velocity (12.90 ± 1.07 cm/s vs. 12.61 ± 1.29 cm/s, p = 0.65) or (C) the number of rearings (95.60 ± 7.99 vs. 78.40 ± 12.40, p = 0.35). Statistical analysis: N = 10 for each group, Mann-Whitney test. * p < 0.05, ** p < 0.005, *** p < 0.001. (D-I) Anxiety related behavior is investigated in the light open field at 4 weeks of age. Overall locomotion or exploratory behavior is not affected in Sema3F mutants in the light open field as determined by (D) the total distance travelled (9505 ± 658.7 cm, N = 21 vs. 9543 ± 809.3 cm, N = 26, p = 0.86), (E) the locomotion velocity (8.586 ± 0.595 cm/s, N = 21 vs. 8.465 ± 0.725, N = 26, p = 0.72) or (F) the number of rearings (60.52 ± 5.57, N = 21, vs. 48.89 ± 6.06, N = 19, p = 0.17). The determination of (G) the distance travelled in the center (1759 ± 172.1 cm, N = 21 vs. 1796 ± 215.8 cm, N = 26, p = 0.66), (H) the time until the first center entry (74.86 ± 19.07 s, N = 21 vs. 106.8 ± 17.59 s, N = 26, p = 0.10) and (I) the number of center visits (69.10 ± 6.09, N = 21 vs. 78.00 ± 9.91, N = 26, p = 0.47) does not reveal any anxiety related behavior in Sema3F mutants. (J-L) Gait of Sema3F animals was analyzed 9 weeks after birth using the CatWalk analysis system. No significant differences were found in (J) the forelimb base of support (14.64 ± 0.73 mm, N = 9 vs. 14.37 ± 0.32 mm, N = 9; p = 1.0), (K) the duty cycle of the forelimbs (59.88 ± 1.43%, N = 9 vs. 57.42 ± 0.86%, N = 9; p = 0.11) or (L) the step pattern of the animals (5.11 ± 0.23, N = 9 vs. 5.07 ± 0.09, N = 9; p = 0.58).Statistical analysis: Mann-Whitney test. * p < 0.05, ** p < 0.005, *** p < 0.001.
Fig 2
Fig 2. Motor coordination of Sema3F mice after housing in different environmental conditions.
(A-F) Motor coordination deficits were analyzed using the ladder rung test. (A) Under normal housing conditions, Sema3F mutants need significantly more time to cross the ladder with irregularly spaced bars than littermate controls at each time point tested (4 weeks: 11.74 ± 0.86 s, N = 14 vs. 25.58 ± 2.56 s, N = 12, p < 0.001; 8 weeks: 9.48 ± 0.75 s, N = 14 vs. 18.92 ± 1.64 s, N = 12, p < 0.001; 12 weeks: 9.41 ± 0.67 s, N = 13 vs. 18.31 ± 1.89 s, N = 12, p < 0.001, Improvement mut 4–12 weeks: p = 0.03). (B) Sema3F mutants also show a significantly increased number of slips (4 weeks: 1.00 ± 0.22, N = 14 vs. 3.11 ± 0.66, N = 12, p < 0.05; 8 weeks: 1.10 ± 0.23, N = 14 vs. 2.61 ± 0.56, N = 12, p < 0.05; 12 weeks: 0.82 ± 0.14, N = 13 vs. 2.03 ± 0.37, N = 12, p < 0.05). (C) After enriched environment housing starting at birth the motor performance of Sema3F mutants reaches wildtype levels at 8 weeks after birth (4 weeks: 10.37 ± 0.76 s, N = 10 vs. 16.74 ± 1.71, N = 9, p < 0.005; 8 weeks: 12.63 ± 0.90 s, N = 10 vs. 15.85 ± 1.54 s, N = 9, p = 0.14; 12 weeks: 11.00 ± 0.98 s, N = 10 vs. 13.48 ± 1.19 s, N = 9, p = 0.07). (D) These animals never show a significant difference in the number of slips compared to wildtype littermates (4 weeks: 1.00 ± 0.21, N = 10 vs. 1.67 ± 0.49, N = 9, p = 0.36; 8 weeks: 0.83 ± 0.16, N = 10 vs. 1.07 ± 0.17, N = 9, p = 0.31; 12 weeks: 0.47 ± 0.09, N = 10 vs. 0.59 ± 0.15, N = 9, p = 0.50). (E) Enriched environment housing starting at 4 weeks after birth does not improve the motor performance of Sema3F mutants. (4 weeks: 15.19 ± 1.17 s, N = 19 vs. 34.06 ± 2.09 s, N = 11,p < 0.001; 8 weeks: 12.61 ± 1.01 s, N = 19 vs. 23.91 ± 2.17 s, N = 11, p < 0.001; 12 weeks: 11.75 ± 0.62 s, N = 19 vs. 21.55 ± 2.22 s, N = 11, p < 0.001). (F) Also the number of slips from the ladder is significantly increased at each time point after enriched environment housing starting at 4 weeks (4 weeks: 1.81 ± 0.24, N = 19 vs. 5.30 ± 0.59, N = 11, p < 0.001; 8 weeks: 1.00 ± 0.15, N = 19 vs. 2.24 ± 0.32, N = 11, p < 0.005; 12 weeks: 1.00 ± 0.24, N = 19 vs. 2.394 ± 0.3140, N = 11, p < 0.005). Statistical analysis: Mann-Whitney test. * p < 0.05, ** p < 0.005, *** p < 0.001. (G-I) Improved performance in the grid walk test is not caused by alterations in general locomotion or exploratory behavior. At the age of 12 weeks, animals that were housed in normal or enriched housing conditions starting at birth do not reveal any significant differences in the open field test as determined by (G) the total distance that was traveled (NH: 14190 ± 867.2 cm, N = 16 vs. 13350 ± 951.9 cm, N = 20; EE: 13110 ± 871.3 cm, N = 23 vs. 12160 ± 983.2 cm, N = 20; ANOVA: p = 0.53), (H) the locomotion speed (NH: 12.62 ± 0.96 cm/s, N = 16 vs. 12.22 ± 0.95 cm/s, N = 20; EE: 11.73 ± 0.81 cm/s, N = 23 vs. 10.79 ± 0.89 cm/s, N = 20; ANOVA: p = 0.54) and the total number of rearings (NH: 79.00 ± 9.41, N = 16 vs. 95.85 ± 8.82, N = 20; EE: 78.17 ± 8.16, N = 23 vs. 73.25 ± 8.28, N = 20; ANOVA: p = 0.27). Statistical analysis: One-way ANOVA. * p < 0.05, ** p < 0.005, *** p < 0.001.
Fig 3
Fig 3. Electromyography reveals innervation defects in Sema3F mutants under all housing conditions.
(A) After stimulation of the musculocutaneous nerve, wildtype animals show a signal in the biceps brachii (green box) while the triceps brachii is not activated (red box) and only the stimulation artefact is visible. In Sema3F mutants the stimulation of the musculocutaneous nerve leads to the activation of biceps brachii and triceps brachii muscles at the same time. This was observed in all housing conditions (normal housing, enriched environment starting at birth and enriched environment starting at 4 weeks). (B) Quantification of activation signals. The table displays the total number of tested animals and the number of animals showing a signal in the respective muscle after activation of the musculocutaneous nerve.
Fig 4
Fig 4. Enriched environment housing starting at birth induces neuroanatomical rearrangements of spinal motor pools.
At 12 weeks of age, motor neurons were retrogradely labeled by injection of Alexa Fluor-conjugated CTBs into the dorsal (red) or ventral (green) muscles of the distal forelimb. (A) The number of retrogradely traced motor neurons in the respective motor pool was comparable in wildtypes and mutants of all housing conditions (dorsal pool: p = 0.83; ventral pool: p = 0.68; N ≥ 3 for each group, one-way ANOVA). (B) Motor pools were reconstructed from labeled motor neurons of the brachial spinal cord. The schematics show the projection of all motor neurons along the anterior-posterior axis. The first and last outline of the ventral horn grey matter are indicated (C) In normal housing conditions the medial motor pool of adult animals is significantly larger in Sema3F mutants compared to their wildtype littermates. In contrast, the lateral motor pool remains unchanged (ventral: 0.00069 ± 0.00012, N = 7 vs. 0.00124 ± 0.00015, N = 5; p < 0.05; dorsal: 0.00089 ± 0.00015, N = 7 vs. 0.00102 ± 0.00027, N = 5; p = 0.66; Student’s t-test). (D) A specific scattering of the pool is evident in the dorsal-ventral direction, while the medial-lateral dimensions of the pool are not affected (dorsal-ventral: 0.13 ± 0.0076, N = 7 vs. 0.18 ± 0.0114, N = 5, p < 0.01; medial-lateral: 0.11 ± 0.0061, N = 7 vs. 0.12 ± 0.0080, N = 5, p = 0.73, Student’s t-test). (E + F) After housing in an enriched environment starting at birth, plastic rearrangements become evident and no motor pool shows a significantly altered area between wildtype and mutant animals (area dorsal: 0.00102 ± 0.00021, N = 5 vs. 0.00113 ± 0.00050, N = 3, p = 0.81; area ventral: 0.00084 ± 0.00024, N = 5 vs. 0.00065 ± 0.00007, N = 3, p = 0.57; scattering medial-lateral: 0.1149 ± 0.0068, N = 5 vs. 0.0979 ± 0.0074, N = 3, p = 0.16; scattering dorsal-ventral: 0.1372 ± 0.0108, N = 5 vs. 0.1506 ± 0.0104, N = 3, p = 0.44, Student’s t-test). (G) Enriched environment starting at 4 weeks does not induce these changes. Here, only the lateral motor pool appears normal while the medial motor pool is still significantly larger in mutants compared to wildtype littermates (dorsal: 0.00065 ± 0.00006, N = 8 vs. 0.00066 ± 0.00015, N = 3, p = 0.94; ventral: 0.00045 ± 0.00004, N = 8 vs. 0.00113 ± 0.00041, N = 3, p < 0.05, Student’s t-test). (H) The analysis of the specific scattering reveals an extension of the pool in dorsal-ventral direction (medial-lateral: 0.1068 ± 0.0021, N = 8 vs. 0.1121 ± 0.004982, N = 3, p = 0.26; dorsal-ventral: 0.1157 ± 0.0031, N = 8 vs. 0.1642 ± 0.0375, N = 3, p < 0.05, Student’s t-test). (I and J) Already at 4 weeks after birth the plastic rearrangements of the medial motor pool due to enriched environment housing are evident. While the medial pool shows a significant dorsal-ventral scattering in normally housed animals (I) (area dorsal: 0.00141 ± 0.00030, N = 5 vs. 0.00132 ± 0.00021, N = 5, p = 0.81; area ventral: 0.00124 ± 0.00020, N = 5 vs. 0.00371 ± 0.00071, N = 5, p < 0.05; scattering dorsal-ventral: 0.1587 ± 0.0139, N = 5 vs. 0.2486 ± 0.0204, N = 5, p < 0.01, Student’s t-test), in animals that were housed in an enriched environment starting at birth the pool has normal dimension (J) (area dorsal: 0.00106 ± 0.00023, N = 5 vs. 0.00151 ± 0.00032, N = 5, p = 0.29; area ventral: 0.00130 ± 0.00023, N = 5 vs. 0.00212 ± 0.00049, N = 5, p = 0.17; scattering dorsal-ventral: 0.1564 ± 0.0109, N = 5 vs. 0.1923 ± 0.0154, N = 5, p = 0.09, Student’s t-test). * p < 0.05, ** p < 0.005, *** p < 0.001.
Fig 5
Fig 5. Most spinal motor neurons are not protected by PNNs.
(A) In the adult spinal cord only few motor neurons retrogradely labeled from the distal ventral forelimb show PNNs (arrow). (B—D) Examples of motor neurons with no, weak, or strong PNNs, respectively. (E) At 4 weeks of age, when the critical period for adaptive plasticity is closed, more than 65% of traced motor neurons are not covered by PNNs, regardless of the housing conditions (NH: wt: 63.6 ± 3.4%; mut: 70.4 ± 3.0%; EE: wt: 66.6 ± 6.8%, mut: 71.6 ± 9.4%; p = 0.43). Weak PNNs are found on less than 30% (NH: wt: 30.7 ± 2.5%; mut: 27.2 ± 2.5%; EE: wt: 29.0 ± 5.3%, mut: 25.9 ± 8.6%; p = 0.72) and less than 5% of motor neurons show strong PNNs (NH: wt: 5.7 ± 1.7%; mut: 2.4 ± 0.6%; EE: wt: 4.4 ± 2.0%, mut: 2.6 ± 0.8%; p = 0.06). Statistical analysis: N = 3 for each group, one-way ANOVA. * p < 0.05, ** p < 0.005, *** p < 0.001. Scale bar: 20 μm.
Fig 6
Fig 6. Excitatory-inhibitory balance of synaptic input is shifted by enriched environment housing.
(A) Example of excitatory (vGlut1) and inhibitory (vGAT) synapses on retrogradely labeled motor neurons of 12 week old animals. (B) The number of inhibitory synapses on traced motor neurons remains unchanged between wildtypes and mutants of all housing conditions (normal housing (wt: 133.5 ± 10.52, mut: 127.3 ± 28.76), enriched environment starting at birth (wt: 122.5 ± 3.85, mut: 125.0 ± 6.63), and enriched environment starting at 4 weeks (wt: 119.4 ± 12.0, mut: 113.2 ± 2.15); N = 3 for each group, p = 0.91, one-way ANOVA). (C) Between Sema3F wildtypes and mutants, the number of excitatory synapses is not significantly altered (NH: wt: 8.32 ± 0.90, mut: 8.13 ± 0.67, p = 0.87; EEbirth: wt: 15.99 ± 2.51, mut: 16.81 ± 3.88, p = 0.75; EE4: wt: 8.70 ± 0.93, mut: 8.43 ± 0.24; N = 3 for each group, Students t-test), however, after enriched environment housing starting at birth the number of excitatory synapses were significantly increased when compared to normal housing conditions or enriched environment starting at 4 weeks (NH vs. EEbirth: wt: p = 0.040, mut: p = 0.022; EEbirth vs. EE4: wt: p = 0.047, mut: p = 0.023, N = 3 for each group, Students t-test). Statistical analysis: N = 3 for each group, Students t-test. * p < 0.05, ** p < 0.005, *** p < 0.001. Scale bar: 20 μm.

References

    1. Huber AB, Kolodkin AL, Ginty DD, Cloutier JF. Signaling at the growth cone: ligand-receptor complexes and the control of axon growth and guidance. Annual review of neuroscience. 2003;26:509–63. Epub 2003/04/05. 10.1146/annurev.neuro.26.010302.081139 PubMed . - DOI - PubMed
    1. Egea J, Klein R. Bidirectional Eph-ephrin signaling during axon guidance. Trends in cell biology. 2007;17(5):230–8. 10.1016/j.tcb.2007.03.004 PubMed . - DOI - PubMed
    1. Kao TJ, Law C, Kania A. Eph and ephrin signaling: lessons learned from spinal motor neurons. Seminars in cell & developmental biology. 2012;23(1):83–91. 10.1016/j.semcdb.2011.10.016 PubMed . - DOI - PubMed
    1. Kramer ER, Knott L, Su F, Dessaud E, Krull CE, Helmbacher F, et al. Cooperation between GDNF/Ret and ephrinA/EphA4 signals for motor-axon pathway selection in the limb. Neuron. 2006;50(1):35–47. 10.1016/j.neuron.2006.02.020 PubMed . - DOI - PubMed
    1. Huber AB, Kania A, Tran TS, Gu C, De Marco Garcia N, Lieberam I, et al. Distinct roles for secreted semaphorin signaling in spinal motor axon guidance. Neuron. 2005;48(6):949–64. Epub 2005/12/21. 10.1016/j.neuron.2005.12.003 PubMed . - DOI - PubMed

Publication types

LinkOut - more resources