. 2015 Apr 23;520(7548):499-504.
doi: 10.1038/nature14402. Epub 2015 Apr 15.

Oxytocin enables maternal behaviour by balancing cortical inhibition

Affiliations

Oxytocin enables maternal behaviour by balancing cortical inhibition

Bianca J Marlin et al. Nature. .

Abstract

Oxytocin is important for social interactions and maternal behaviour. However, little is known about when, where and how oxytocin modulates neural circuits to improve social cognition. Here we show how oxytocin enables pup retrieval behaviour in female mice by enhancing auditory cortical pup call responses. Retrieval behaviour required the left but not right auditory cortex, was accelerated by oxytocin in the left auditory cortex, and oxytocin receptors were preferentially expressed in the left auditory cortex. Neural responses to pup calls were lateralized, with co-tuned and temporally precise excitatory and inhibitory responses in the left cortex of maternal but not pup-naive adults. Finally, pairing calls with oxytocin enhanced responses by balancing the magnitude and timing of inhibition with excitation. Our results describe fundamental synaptic mechanisms by which oxytocin increases the salience of acoustic social stimuli. Furthermore, oxytocin-induced plasticity provides a biological basis for lateralization of auditory cortical processing.


Conflict of interest statement

The authors declare no competing financial interests.

Figures

Extended Data Figure 1
Expression of ChETA in oxytocinergic PVN neurons of Oxt-IRES-Cre animals. a, Preparation of Oxt-IRES-Cre mice for optogenetic stimulation of endogenous oxytocin release. Animals had an AAV expressing the ChETA variant of channelrhodopsin-2 and YFP (AAV5Ef1a-DIO ChETA-EYFP) stereotaxically injected into left PVN (left) and cannulas for fiber optic stimulation implanted either in PVN (middle) or left AI (right). b, Confirmation of viral expression in PVN. Green, YFP. Blue, DAPI. Scale, 100 μm.
Extended Data Figure 2
Retrieval success rates over time. a, Examples of retrieval rate from three different virgin females receiving optogenetic stimulation of PVN (blue), oxytocin injections (red), or saline injections (black). Each data point is the average over 10 two-minute trials immediately after injection or optical stimulation. b, Mean retrieval success at each time point for all co-housed virgin animals (including those that never retrieved within the first three days of co-housing). Some animals that began retrieving at earlier time points were not assessed at later time points and instead used for electrophysiological experiments.
Extended Data Figure 3
Oxytocin receptor expression in virgin female mouse auditory cortex, amygdala, and lateral septum. OXTR-2 labeling was detected in each area in wild-type but not oxytocin receptor knockout animals. a, Oxytocin receptor expression measured with OXTR-2 immunostaining in layer 5 of left auditory cortex of naïve wild-type animal (left) or oxytocin receptor knockout animal (right) imaged at 20X. Red, OXTR-2; blue, DAPI. Scale, 100 μm. b, OXTR-2 immunostaining in amygdala of wild-type animal (left) or oxytocin receptor knockout animal (right) imaged at 10X. Scale, 100 μm. c, OXTR-2 immunostaining in lateral septum of wild-type animal (left) or oxytocin receptor knockout animal (right) imaged at 10X. Scale, 100 μm.
Extended Data Figure 4
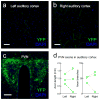
Oxytocinergic projections from hypothalamus to auditory cortex. We identified YFP-positive axon segments in sections from Oxt-IRES-Cre animals. a, Oxytocinergic projections in left auditory cortex. Green, YFP. Blue, DAPI. Scale, 100 μm. b, Oxytocinergic projections in right auditory cortex from same animal as in a. Scale, 100 μm. c, Oxytocinergic fibers and cells in PVN from same animal as in a and b. Scale, 100 μm. d, Quantification of axon segment length and number of axonal branches in left and right auditory cortex. No significant differences were found in total length or branch number in left vs. right cortex (left axon length: 0.94±0.19 mm, right axon length: 0.92±0.44 mm, n=3 mice, p>0.9, Student’s paired two-tailed t-test; left: 47.3±6.0 axon branches, right: 45.6±19.6 axon branches, p>0.9).
Extended Data Figure 5
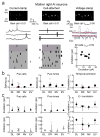
Spiking and synaptic pup call responses in dam right AI neurons. a, Three example recordings from right AI neurons of experienced mothers. Left, current-clamp recording. Top, spectrogram of best pup call; middle, three example traces evoked by this call; bottom, raster plot showing spikes evoked over 12 trials (spiking z-score: 0.2; trial-by-trial average correlation r: 0.01). Middle, cell-attached recording (spiking z-score: 0.1; trial-by-trial correlation r: 0.01). Right, voltage-clamp recording. IPSCs and EPSCs shown were evoked by the best pup call (gray, individual trials; red, average; rei-best: 0.05, rei-all: −0.59). b, Summary of spiking responses in dam right (‘DR’) AI neurons. Shown for comparison are responses from left AI neurons of dams (‘DL’), naive virgins (‘NV’), and experienced virgins (‘EV’) from Figure 4. Left, spiking responses to best pup calls (gray filled squares, current-clamp; open gray squares, cell-attached recordings; black squares, median z-score: 0.2±0.8, n=7, p>0.7 compared to naive virgin responses with Wilcoxon-Mann-Whitney two-sample rank test with Bonferroni correction for multiple comparisons, U=76). Middle, spiking responses to pure tones (median z-score: 1.6±0.3, n=8, p>0.4 compared to naive virgin responses, U=83). Right, trial-by-trial correlation of pup call spiking responses (median r: 0.01±0.04, n=7, p>0.6 compared to naive virgin responses, U=78). Red squares indicate cells shown in a. c, Summary of synaptic responses in dam right AI neurons. Shown for comparison are responses from left AI neurons of dams, naive virgins, and experienced virgins from Figure 5. Top left, EPSCs evoked by best pup calls (median EPSC: −11.0±4.7, n=4, p>0.8 compared to naive virgin responses, U=60). Bottom left, IPSCs evoked by best pup calls (median IPSC: 16.0±7.0, n=4, p>0.4 compared to naive virgin responses, U=68). Top middle, EPSCs evoked by pure tones (median EPSC: −33.8±44.1, n=7, p>0.4 compared to naive virgin responses, U=52). Bottom middle, IPSCs evoked by pure tones (median IPSC: 22.9±35.7, n=7, p>0.7 compared to naive virgin responses, U=45). Top right, excitatory-inhibitory correlations in temporal profiles of best call responses (median rei-best: 0.08±0.14, n=4, p>0.7 compared to naive virgin responses, U=60). Bottom right, excitatory-inhibitory correlations across all calls (median rei-all: 0.05±0.37, n=4, p>0.8 compared to naive virgin responses, U=59). Red triangles indicate cell shown in a. Statistics are medians ± s.e.m. and error bars are medians ± interquartile range.
Extended Data Figure 6
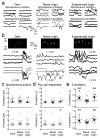
Pup call responses in experienced vs. naive females differ in timing but not overall amplitude. a, Example periods of spontaneous excitation and inhibition in absence of pup call stimuli; same recordings as in Figure 5a. b, Example call-evoked IPSCs and EPSCs from left AI neurons; same recordings as in Figure 5a. Left column, neuron from dam. Top, spectrogram. Middle, IPSCs evoked by the best pup call (three individual trials are shown; average trial-by-trial correlation across all trials ri: 0.65). Note similarity and shared temporal structure across individual trials in this cell. Bottom, EPSCs evoked by this call (re: 0.85). Middle column, neuron from naive virgin (ri: −0.01; re: 0.02). Right column, neuron from experienced virgin (ri: 0.35; re: 0.55). c, Summary of spontaneous excitation (top, filled triangles) and inhibition (bottom, open triangles) measured as instantaneous current (pA). Spontaneous activity was similar in left AI neurons from dams (black triangle, median excitation: −1.2±0.9 pA, n=13, p>0.7 compared to naive virgin spontaneous activity with Wilcoxon-Mann-Whitney two-sample rank test with Bonferroni correction for multiple comparisons, U=178; open triangle, median inhibition: 0.6±0.8 pA, p>0.3 compared to naive virgin responses, U=193), naive virgins (median excitation: −1.7±0.7 pA, n=28; median inhibition: 1.1±0.8 pA), and experienced virgins (‘Exp virgin’, median excitation: −0.6±0.7 pA, n=13, p>0.1 compared to naive virgin spontaneous activity, U=232; median inhibition: 1.3±0.7 pA, p>0.5 compared to naive virgin responses, U=168). Red triangles indicate cells shown in a and b. d, Summary of z-scored call-evoked EPSCs (top) and IPSCs (bottom) relative to spontaneous activity in dams (filled triangle, median excitation z-score: 1.8±1.4, n=13, p>0.1 compared to naive virgin responses, U=215; open triangle, median inhibition z-score: 2.0±1.6, p>0.1 compared to naive virgin responses, U=181), naive virgins (median excitation z-score: 1.4±0.3, n=28; median inhibition z-score: 1.4±0.6), and experienced virgins (median excitation z-score: 2.5±1.0, n=13, p>0.1 compared to naive virgin responses, U=250; median inhibition z-score: 2.7±0.9, p<0.02 compared to naive virgin responses, U=228). Red triangles indicate cells shown in a and b. e, Summary of trial-by-trial correlations in temporal profile of best call responses for EPSCs (top, re) and IPSCs (bottom, ri) for dams (re: 0.25±0.08, n=12, p<10−4 compared to naive virgin responses, U=294; ri: 0.18±0.08, p<0.01 compared to naive virgin responses, U=230), naive virgins (re: 0.0±0.03, n=28; ri: 0.01±0.03), and experienced virgins (re: 0.31±0.09, n=13, p<0.007 compared to naive virgin responses, U=285; ri: 0.24±0.07, p<0.001 compared to naive virgin responses, U=233). Red circles indicate cells shown in a and b. *, p<0.05, **, p<0.01. Statistics are medians ± s.e.m. and error bars are medians ± interquartile range.
Extended Data Figure 7
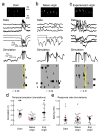
Simulations of spikes predicted from currents measured in voltage-clamp recordings. a, Neuron from dam left AI (same cell as in Fig. 5a, left). Top, experimental data. Three representative EPSCs and three IPSCs evoked by the best call are displayed. Bottom, results of simulation. The membrane potential and spikes (clipped for display) of one trial run is shown, with a raster plot of 12 trials below. Yellow events indicate spikes that are synchronous within ~10 msec on 50%+ trials. There was a high trial-to-trial correlation in spike firing (r: 0.26). b, Neuron from naive virgin left AI (same cell as in Fig. 5a, middle). Simulations using currents recorded in this cell predicted a low trial-to-trial correlation (r: 0.04). c, Neuron from experienced virgin left AI (same cell as in Fig. 5a, right). Simulations predicted a high trial-to-trial correlation (r: 0.31). d, Summary of simulated trial-by-trial spiking correlations for all voltage-clamp recordings from Figure 5 of dams (median r: 0.25±0.04, n=12, p<0.0004 compared to simulated naive virgin responses with Wilcoxon-Mann-Whitney two-sample rank test with Bonferroni correction for multiple comparisons, U=269), naive virgins (median r: 0.07±0.02, n=26), and experienced virgins (median r: 0.31±0.10, n=11, p<0.04 compared to simulated naive virgin responses, U=213). Red squares indicate cells shown in ac. Note similarity to spike timing correlations measured experimentally and shown in Figure 4e. **, p<0.01; *, p<0.05. e, Summary of simulated call-evoked firing rates of dams (median: 2.5±1.1 Hz, n=12, p>0.8 compared to naive virgin responses, U=161), naive virgins (median: 2.7±0.5 Hz, n=23), and experienced virgins (median: 3.2±0.6 Hz, n=11, p>0.6 compared to naive virgin responses, U=157). The simulated call-evoked responses were similar across each group due to the normalization of evoked current amplitudes; normalizing peak EPSCs and IPSCs allowed us to examine changes in spike timing independently from changes in overall spike rate. Statistics are medians ± s.e.m. and error bars are medians ± interquartile range.
Extended Data Figure 8
Oxytocin receptor activation disinhibits cortical neurons in brain slices. a, Photomicrograph showing whole-cell recording from layer 5 pyramidal neuron in brain slice of virgin female mouse auditory cortex. b, Example voltage-clamp recording of IPSCs evoked by extracellular stimulation. Oxytocin (‘OT’) was washed into the bath for 5 minutes. Red bar, duration of oxytocin washin. Dashed line, baseline IPSC amplitude. **, p<0.01. Inset, IPSCs before (black) and 3–5 minutes after washin (red). c, Example voltage-clamp recording of IPSCs evoked by extracellular stimulation in brain slice from Oxt-IRES-Cre mouse expressing ChETA in oxytocin neurons. Oxytocin release was evoked by blue light (‘hυ’) for three minutes. *, p<0.05. d, Summary of changes to evoked IPSCs 3–5 minutes after oxytocin receptor activation, by exogenous oxytocin washin (red; 78.0±5.3% of baseline amplitude; n=12, p<0.002 compared to baseline; prevented by OTA, 108.6±8.6% of baseline amplitude; n=3, p>0.4 compared to baseline) or by optogenetic release of endogenous oxytocin (86.7±4.7% of baseline amplitude; n=5, p<0.05 compared to baseline; prevented by OTA, 101.2±1.2% of baseline amplitude; n=4, p>0.8 compared to baseline). Statistics and error bars are means± s.e.m.
Extended Data Figure 9
Oxytocin pairing increases the trial-by-trial similarity of synaptic pup call responses. a Same voltage-clamp recording from virgin female left AI neuron as in Figure 6c, showing that trial-by-trial similarity of call-evoked IPSCs and EPSCs is initially low but increases after oxytocin pairing. Shown are four representative IPSCs and EPSCs before pairing (inhibitory trial-by-trial correlation ri: 0.04, excitatory trial-by-trial correlation re: 0.00), during pairing (ri: 0.08, re: 0.49), 10–15 minutes after pairing (ri: −0.01, re: 0.58), and 45–50 minutes after pairing (ri: 0.13, re: 0.48). Scale: 75 pA (150 pA during pairing), 200 msec. b, Summary of changes to synaptic trial-by-trial correlations after oxytocin pairing in virgin left AI. Left, change in excitatory correlations (re) across multiple cells for hours after pairing. Blue, optogenetic pairing (‘opto’); red, oxytocin pairing (‘OT’); black, means binned over time (n=28 cells from 17 animals; re before pairing: 0.01±0.02, re 0–45 minutes after pairing: 0.16±0.03, p<0.0002 compared to values before pairing; re 1–3 hours after pairing: 0.16±0.04, p<0.0009 compared to values before pairing). Dashed line, initial average re; arrow, time of pairing. Right, change in ri (ri before pairing: 0.01±0.02, ri 0–45 minutes after pairing: 0.04±0.02, p>0.1 compared to values before pairing; ri 1–3 hours after pairing: 0.14±0.03, p<0.0002 compared to values before pairing). Statistics and error bars are means ± s.e.m.
Figure 1
Figure 1
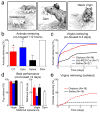
Oxytocin enables pup retrieval. a, Retrieval behavior. b, Initially-naive virgins retrieving 1+ times <12 hours after co-housing (oxytocin: 20/36 animals, p<0.03; optogenetic PVN stimulation: 5/7 animals, p<0.05; saline: 6/27 animals). *, p<0.05. Error bars:means±95% confidence intervals. c, Cumulative retrieval during co-housing. d, Retrieval rates (p>0.5) and speed (p>0.1) were similar in dams and experienced virgins. Error bars:means±s.e.m. e, Cumulative retrieval of saline-injected (N=16) or oxytocin-injected (N=19) isolated virgins (2 days post-testing, saline: 2/16 animals retrieved, oxytocin: 4/19 animals, p>0.6; 6 days, saline: 2/16 animals, oxytocin: 9/19 animals, p<0.03).
Figure 2
Figure 2
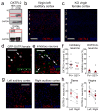
Oxytocin receptor expression in female auditory cortex. a, Antibody to mouse oxytocin receptor (OXTR-2). Top, immmunoblot of HEK cells expressing oxytocin receptors (‘OTR’) vs. control (‘C’). Bottom, OXTR-2 immunoblots of cortical lysates from wild-type (‘WT’), knockout animals (‘KO’). Red, oxytocin receptor molecular weight (43 kD). GAPDH, loading controls. b, Immunostaining in left auditory cortex of naïve virgin. Scale: 150 μm. c, No labeling in oxytocin receptor knockouts. Scale: 150 μm. d, Left auditory cortex of eGFP-oxytocin receptor virgin co-stained for eGFP. Arrows, double-labeled cells. Scale: 50 μm. e, Cortical interneurons express oxytocin receptors. Virgin left auditory cortex layer 5 co-stained for parvalbumin/somatostatin. Scale: 50 μm. f, Co-labeled OXTR-2+ and PV+/SST+ auditory cortical cells. g, Left, right auditory cortex from same naive virgin. Scale: 100 μm. h, Oxytocin receptors expressed more in left auditory cortex (mothers, left: 17.4±2.0%, right: 12.7±2.4%, left/right asymmetry: 37.0%, p<0.03, N=7; virgins, left: 19.5±1.2%, right: 14.3±1.4%, asymmetry: 36.4%, p<0.02, N=12). Statistics, error bars:means±s.e.m.
Figure 3
Figure 3
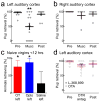
Oxytocin receptors in left auditory cortex are initially required for retrieval. a, Muscimol infused into left AI reduced retrieval by experienced animals (pre-muscimol retrieval: 96.9±2.0%, 16/16 animals retrieving 1+ times; muscimol: 48.8±10.0%, p<0.002, 11/16 animals retrieving, p<0.025). **, p<0.01. Statistics, error bars:means±s.e.m. b, Muscimol in right AI did not impair retrieval (pre-muscimol: 100.0±0.0%, muscimol: 87.5±12.5%, p>0.9; 5/5 animals retrieved). c, Oxytocin in left AI of naive virgins accelerated time to first retrieval <12 hours of co-housing (oxytocin: 12/16 animals, p<0.05; optogenetic stimulation: 7/8 animals, p<0.04; saline: 3/11 animals). Error bars:means±95% confidence intervals. d, Retrieval of experienced animals with OTA (baseline: 96.3±2.6%, OTA: 80.0±6.8%, p>0.05; 8/8 animals) or L-368,899 (baseline: 100.0±0.0%, L-368,899: 86.7±3.3%, p>0.1, N=3; 3/3 animals) infused into left AI.
Figure 4
Figure 4
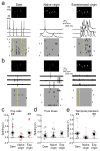
Pup calls evoke reliable spikes in experienced female left AI. a, Current-clamp recordings in left AI of dam (spiking z-score: 4.7; trial-by-trial average correlation r: 0.21), naive virgin (z-score: 0.1; r:−0.04), experienced virgin (z-score: 8.3; r: 0.27). b, Cell-attached recordings from dam (z-score: 5.8; r: 0.87), naive virgin (z-score: 1.4; r: 0.04), experienced virgin (z-score: 2.1; r: 0.96). c, Current-clamp (filled) or cell-attached (open) call-evoked responses in dams (black, z-score: 2.1±1.0, n=17, p<0.0004, U=288), naive virgins (z-score: 0.2±0.3, n=20), experienced virgins (z-score: 2.0±0.8, n=14, p<0.006, U=240). Statistics:medians±s.e.m.; error bars: medians±interquartile range. d, Tone-evoked responses in left AI of dams (z-score: 0.7±0.5, n=17, p>0.7, U=154), naive virgins (z-score: 0.8±0.6, n=17), experienced virgins (z-score: 1.7±0.4, n=11, p>0.6, U=105). e, Trial-by-trial correlation in dams (r: 0.21±0.07, n=17, p<0.002, U=276), naive virgins (r: 0.03±0.03, n=20), experienced virgins (r: 0.18±0.08, n=14, p<0.012, U=219). Red, cells in a, b.
Figure 5
Figure 5
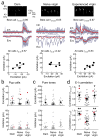
Pup calls evoke correlated patterns of excitatory and inhibitory responses in left AI of experienced females. a, Voltage-clamp recordings from dam (top, best call responses, rei-best: 0.89; bottom, IPSCs and EPSCs across calls, rei-all: 0.57), naive virgin (rei-best: 0.05; rei-all:−0.22), experienced virgin (rei-best: 0.67; rei-all: 0.83). b, Synaptic call-evoked responses from dams (excitation:−9.3±3.1 pA, n=13, p>0.3, U=229; inhibition: 11.6±2.8 pA, p>0.5, U=182), naive virgins (excitation:−6.2±3.3 pA, n=28; inhibition: 8.7±2.7 pA), experienced virgins (excitation:−10.8±3.6 pA, n=13, p>0.6, U=205; inhibition: 9.2±9.5 pA, p>0.4, U=171). Red, cells in a. Statistics:medians±s.e.m.; error bars: medians±interquartile range. c, Tone-evoked responses in dams (excitation:−40.6±16.7 pA, n=10, p>0.4, U=123; inhibition: 28.7±9.6 pA, p>0.7, U=108), naive virgins (excitation:−21.6±14.8 pA, n=21; inhibition: 21.8±13.2 pA), experienced virgins (excitation:−45.2±13.8 pA, n=9, p>0.5, U=107; inhibition: 54.7±16.4 pA, p>0.1, U=92). d, Excitatory-inhibitory correlation of best call responses (top, rei-best) and across all calls (bottom, rei-all) dams (rei-best: 0.30±0.12, n=12, p<0.03, U=245; rei-all: 0.67±0.11, p<0.0004, U=278), naive virgins (rei-best: 0.00±0.08, n=27; rei-all:−0.13±0.13), experienced virgins (rei-best: 0.29±0.13, n=12, p<0.03, U=224; rei-all: 0.62±0.14, p<0.006, U=236).
Figure 6
Figure 6
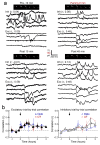
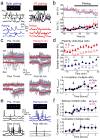
Oxytocin pairing modifies excitatory-inhibitory balance. a, Call-evoked IPSCs from virgin left AI neuron before/during optogenetic (blue) or oxytocin pairing (red). b, Oxytocin reduced inhibition within 40–60 seconds (top; optogenetic pairing, n=4, p<0.002; oxytocin pairing, n=12, p<0.04). c, Voltage-clamp recording from virgin left AI neuron (pre-pairing IPSCs: 8.3±1.1 pA, pre-pairing EPSCs:−8.0±1.2 pA, rei-paired: 0.13; pairing IPSCs: 6.5±1.5 pA, EPSCs:−10.4±3.0 pA, rei-paired:−0.12; 10–15 minutes post-pairing IPSCs: 4.9±0.9 pA, p<0.0009, EPSCs:−15.4±1.3 pA, p<0.005, rei-paired:−0.14; 45–50 minutes post-pairing IPSCs: 9.6±2.1 pA, p>0.5, EPSCs:−13.4±2.4 pA, p<0.002, rei-paired: 0.27). Statistics, error bars:means±s.e.m. d, Synaptic modifications. Top, individual neurons after oxytocin (EPSC increase: 43.5±15.7%, n=10, p<0.03; IPSC decrease:−33.7±7.8%, p<0.004) or optogenetic pairing (EPSC increase: 47.5±13.2%, n=6, p<0.02; IPSC decrease:−20.0±4.3%, p<0.02). Bottom, excitatory-inhibitory correlation (n=28 cells, 17 animals; rei-paired pre-pairing:−0.07±0.05, rei-paired 0–45 minutes post-pairing: 0.02±0.04, p>0.1; rei-paired 1–3 hours post-pairing: 0.24±0.06, p<0.0002). e, Two current-clamp recordings from same virgin; first cell before optogenetic pairing (z-score: 0.04, r: 0.01), during pairing (z: 0.51, r: 0.00), 10–15 minutes post-pairing (z: 0.57, r: 0.03); second cell 180–190 minutes post-pairing (z: 1.60, r: 0.11). f, Spiking. Top, call-evoked spiking (n=28 cells, 13 animals; z-score pre-pairing:−0.13±0.11, 0–45 minutes post-pairing: 0.91±0.27, p<0.003; z-score 1–3 hours post-pairing: 1.21±0.25, p<10−4). Bottom, trial-by-trial correlation (pre-pairing r: 0.01±0.01; 0–45 minutes post-pairing: 0.05±0.02, p>0.1; 1–3 hours post-pairing: 0.14±0.03, p<10−4).

Comment in

References

    1. Richard P, Moos F, Freund-Mercier MJ. Central effects of oxytocin. Physiol Rev. 1991;71:331–370. - PubMed
    1. Gimpl G, Fahrenholz F. The oxytocin receptor system: structure, function, and regulation. Physiol Rev. 2001;81:629–683. - PubMed
    1. Insel TR, Young LJ. The neurobiology of attachment. Nat Rev Neurosci. 2001;2:129–136. - PubMed
    1. Insel TR. The challenge of translation in social neuroscience: a review of oxytocin, vasopressin, and affiliative behavior. Neuron. 2010;65:768. - PMC - PubMed
    1. Bartz JA, Zaki J, Bolger N, Ochsner KN. Social effects of oxytocin in humans: Context and person matter. Trends Cogn Sci. 2011;15:301–309. - PubMed

Publication types