. 2015 Apr 15;10(4):e0121681.
doi: 10.1371/journal.pone.0121681. eCollection 2015.

Bistability: requirements on cell-volume, protein diffusion, and thermodynamics

Affiliations

Bistability: requirements on cell-volume, protein diffusion, and thermodynamics

Robert G Endres. PLoS One. .

Abstract

Bistability is considered wide-spread among bacteria and eukaryotic cells, useful, e.g., for enzyme induction, bet hedging, and epigenetic switching. However, this phenomenon has mostly been described with deterministic dynamic or well-mixed stochastic models. Here, we map known biological bistable systems onto the well-characterized biochemical Schlögl model, using analytical calculations and stochastic spatiotemporal simulations. In addition to network architecture and strong thermodynamic driving away from equilibrium, we show that bistability requires fine-tuning towards small cell volumes (or compartments) and fast protein diffusion (well mixing). Bistability is thus fragile and hence may be restricted to small bacteria and eukaryotic nuclei, with switching triggered by volume changes during the cell cycle. For large volumes, single cells generally loose their ability for bistable switching and instead undergo a first-order phase transition.


Conflict of interest statement

Competing Interests: The authors have declared that no competing interests exist.

Figures

Fig 1
Fig 1. Mapping of bistable systems onto Schlögl model.
(A) Self-activating gene with cooperativity. (B) Phosphorylation-dephosphorylation cycle. (C) Schematic bifurcation diagram with bistable regime indicated by vertical dashed lines. (D, E) Chemical reactions corresponding to (A) and (B), respectively. (D) S is substrate (nucleotides for mRNA and amino acids for protein etc.) and P is protein product. (E) Quantities I, K, P (P p), and P i are the inhibitor, kinase, (phosphorylated) protein, and inorganic phosphate, respectively. (F) Chemical reactions of Schlögl model with concentrations A and B adjustable parameters. For mapping reactions in (D) onto reactions in (F) gene species needs to be absorbed into rate constants, and S and P identified with A/B and X, respectively. For mapping (E) onto (F) I, K, ADP, and P need to be absorbed into rate constants, and P p identified with X, P i with A, and ATP with B.
Fig 2
Fig 2. Properties of macroscopic bistable system.
(A) Bifurcation diagram x(B) with the low stable steady state in blue, the unstable steady state (saddle point) in red, and high stable steady state in black for standard parameters defined in Materials and Methods. Black arrow indicates bistable regime. (B) Corresponding entropy production rate as defined in Equation 2. (C) Phase diagram showing monostable states (only low or high state) and bistable regions in β-γ plane with combination parameters β = k −1 k +2/(k −2 B)2 and γ=k+1Ak+22/(k23B). Two phase diagrams correspond to v = (k −2 B/k +2)V given by 37 (exemplified by combination V = 10, B = 3.7 and standard parameters; black lines) and ∞ (red lines). The latter corresponds to the macroscopic mean-field model. SP indicates point (β, γ) = (0.22, 0.14) corresponding to standard parameters with B = 3.7 (see S1 Text and [31] for details).
Fig 3
Fig 3. Well-mixed bistable system.
(A) Schematic of well-mixed system with volume V (diffusion constant D is infinitely large). (B) Exemplar time trace for x = X/V from Gillespie algorithm for standard parameters with V = 10 and B = 4.0. (C) Exact probability distribution p(x) at steady state from master Equation 3 for V = 10 (dark symbols) and 30 (light symbols) with B = 4.0. (D) Values of p(x) evaluated at three steady states for different values of B. (E) Transition rates from a modified Fokker-Planck approximation valid for large V (first-mean passage time; see S1 Text for details). Red arrows indicate exchange of stability. (F) Maxwell-like construction (MC), indicating coexistence between two phases (low and high states) at B ∼ 3.7, defined by equal transition rates in (E). At this critical value of B a first-order phase transition occurs (see S1 Text for an analytical derivation based on simpler potential). (G) Relative strength of fluctuations (standard deviation over mean) as a function of B for V = 30 (solid line), 50 (dashed line), and 100 (dotted line). (Inset) Unnormalized variances.
Fig 4
Fig 4. Bistable system with diffusion.
(A) Schematic of diffusing molecules in volume V. (B) Snapshot of cubic reaction volume for generalized Schlögl model as simulated with Smoldyn software [38]. Shown are monomers X in red and dimers X 2 in green. Clustering is illustrated by red dashed outline. (C) Chemical reactions of generalized Schlögl model. (D) Time trace (left) and histogram (right) of x = X/V from simulation for D = 3 (for X) and 1 (X 2), V = 10, k +3 = k −3 = 1, and B = 3.7. (E) and (F) Effects of reduced (times 0.1) diffusion constants (E) and increased (times 2) volume (F). In (E) B = 3.1 to achieve comparable weights of low and high states. (G) Schematic of localized transcription in self-activating gene pathway. (H) Snapshot of spherical reaction volume with cylindrical DNA (purple) as simulated with Smoldyn. Shown are monomers in red and dimers in green with illustration of clustering by red dashed outline. (I) Histogram of monomer concentration x from simulation for V = 2.14 and V DNA = 1.51, D = 30 (X) and 10 (X 2), k +1 = k +2 = 50 and B = 50.
Fig 5
Fig 5. Fragility of bistability.
(A) Histograms of monomer concentration x as a function of control parameter B (from 3.4 to 3.9 in steps of 0.1) with other parameters chosen as in Fig 4D. (B) Radial pair-correlation function for D = 3 (X) and 1 (X 2) (dashed black line) and D = 0.3 (X) and 0.1 (X 2) (solid black line) compared with random distribution (red line; see Material and Methods for details). (C) Range of B values with visible bimodal distribution from master equation (well-mixed, black line) and (inhomogeneous) Smoldyn simulations for D = 3 (X) and 1 (X 2) (blue line) and D = 30 (X) and 10 (X 2) (red line) in units of μm 2/s, the latter being typical protein diffusion constants in the cytoplasm. System was classified bistable when 10,000-long simulations (see Materials and Methods) started in low and high states showed at least one reversible switch. Note that parameters are converted to physical units here (see Materials and Methods for details). Hence, a 10,000-long-simulation corresponds to a duration of 2.78h, which is a very conservative estimate of cell-division times in bacteria and yeast. Shaded areas indicate bacterial (dark) and eukaryotic nuclear (light) volumes for comparison.
Fig 6
Fig 6. Diffusion can be included by renormalization of second-order rate constants.
(A) Histograms of monomer frequency for different B values from simulations with Smoldyn software [38] (first row) and Gillespie simulations of the generalized Schlögl model with (second row) and without (third row) renormalized rate constants of second-order reactions. Standard parameters were used with volume V = 10. The Kullback-Leiber divergence (D KL) shows the closer correspondence of the renormalized reactions than the normal reactions with Smoldyn (forth row). For details on renormalization and calculation of D KL, see Materials and Methods. (B) Corresponding macroscopic bifurcation diagram of deterministic ordinary-differential equation model using renormalized rate constants k ±2 to illustrate effect of diffusion. This shows that diffusion delays entry into bistable regime for increasing B.
Fig 7
Fig 7. Onset of traveling waves in spatially extended system.
(A) Snapshot of elongated reaction volume for generalized Schlögl model as simulated with Smoldyn software [38]. Shown are monomers X in red and dimers X 2 in green. (B) Kymographs of monomer numbers along major axis of simulation box (distance) as a function of simulation time. For this purpose box was divided into 20 equal sized bins. Parameter values: Standard parameters were chosen with volume of simulation box V = 10 ⋅ 1.5 ⋅ 1.5, B values as indicate in subpanels of (B), and other parameters as in Fig 4D. Steepness of white dashed lines illustrates magnitude of wave velocity.
Fig 8
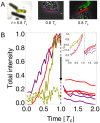
Fig 8. Switching may be triggered by cell-volume changes.
(A) Snapshots from time-lapse fluorescence microscopy: (left) lacY-gfp of E. coli in yellow [43], (middle) PcomK-cfp of B. subtilis in purple, and (right) PcomG-cfp of B. subtilis in red [2] with time in units of cell-cycle time T c. (B) Total fluorescence intensities inside cell contours normalized to the maximal observed total intensity of a cell (see Materials and Methods for details) with color-coding same as in panel (A). Two yellow daughter cells are shown by solid and dashed lines. Note also the appearance of multiple red and purple daughter cells right after cell division in competence. (Inset) Normalized cell lengths over time in units of maximal cell length L max. S6 Fig shows same for intensity density, i.e. total intensity divided by cell area.

Similar articles

Cited by

References

    1. Ozbudak EM, Thattai M, Lim HN, Shraiman BI, van Oudenaarden A. Multistability in the lactose utilization network of Escherichia coli . Nature, 2004; 427: 737–740. 10.1038/nature02298 - DOI - PubMed
    1. Süel GM, Garcia-Ojalvo J, Liberman LM, Elowitz MB. An excitable gene regulatory circuit induces transient cellular differentiation. Nature, 2006; 440: 545–550. 10.1038/nature04588 - DOI - PubMed
    1. Xiong W, Ferrell JE Jr. A positive-feedback-based bistable’memory module’ that governs a cell fate decision. Nature, 2003; 426: 460–465. 10.1038/nature02089 - DOI - PubMed
    1. Lai K, Robertson MJ, Schaffer DV. The sonic hedgehog signaling system as a bistable genetic switch. Biophys J, 2004; 86: 2748–2757. - PMC - PubMed
    1. Markevich NI, Hoek JB, Kholodenko BN. Signaling switches and bistability arising from multisite phosphorylation in protein kinase cascades. J Cell Biol, 2004; 164: 353–359. 10.1083/jcb.200308060 - DOI - PMC - PubMed

Publication types

LinkOut - more resources