

Finding HIV in hard to reach populations: mobile HIV testing and geospatial mapping in Umlazi township, Durban, South Africa
- PMID: 25874754
- PMCID: PMC4531102
- DOI: 10.1007/s10461-015-1012-3
Finding HIV in hard to reach populations: mobile HIV testing and geospatial mapping in Umlazi township, Durban, South Africa
Abstract
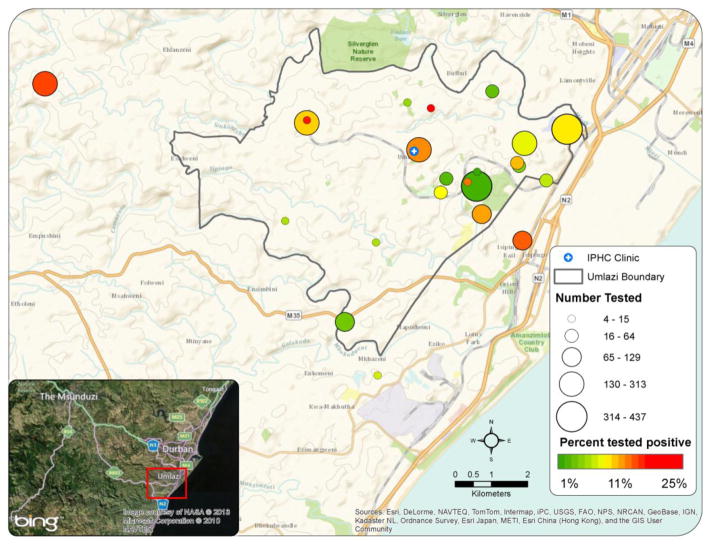
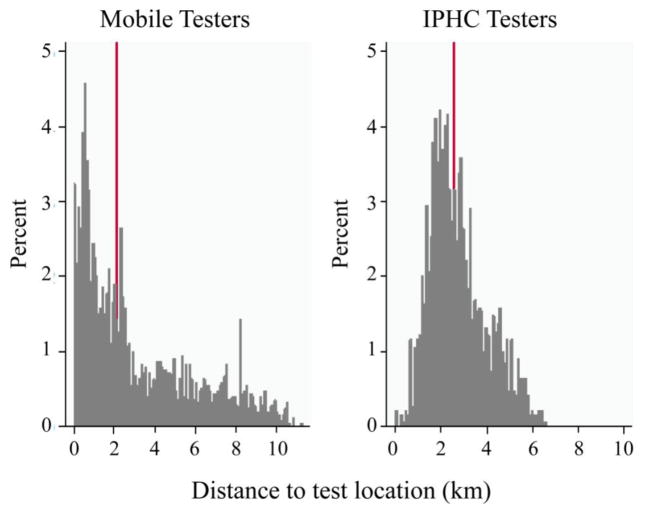
Mobile, community-based HIV testing may help achieve universal HIV testing in South Africa. We compared the yield, geographic distribution, and demographic characteristics of populations tested by mobile- and clinic-based HIV testing programs deployed by iThembalabantu Clinic in Durban, South Africa. From July to November 2011, 4,701 subjects were tested; HIV prevalence was 35 % among IPHC testers and 10 % among mobile testers (p < 0.001). Mobile testers varied in mean age (22-37 years) and % males (26-67 %). HIV prevalence at mobile sites ranged from 0 to 26 %. Testers traveled further than the clinic closest to their home; mobile testers were more likely to test ≥5 km away from home. Mobile HIV testing can improve testing access and identify testing sites with high HIV prevalence. Individuals often access mobile testing sites farther from home than their nearest clinic. Geospatial techniques can help optimize deployment of mobile units to maximize yield in hard-to-reach populations.
Keywords: Geospatial analysis; HIV mobile testing; South Africa.
Conflict of interest statement
The authors declare no conflicts of interest.
Figures
References
-
- Republic of South Africa Department of Health. [Accessed 24 April 2014];Global AIDS Response Progress Report. 2012 Available at: http://www.unaids.org/en/dataanalysis/knowyourresponse/countryprogressre....
-
- Republic of South Africa Department of Health. [Accessed on 24 April 2014];National Strategic Plan on HIV, STIs and TB. 2012–2016 Available at: http://laylacassim.co.za/pdf/National%20Strategic%20Plan%20on%20HIV,%20S....
-
- Shisana O, Rehle T, Simbayi L, Zuma K, Jooste S, Zungu N, et al. South African National HIV Prevalence, Incidence and Behaviour Survey 2012. Cape Town: HSRC Press; 2014. - PubMed
Publication types
MeSH terms
Grants and funding
LinkOut - more resources
Full Text Sources
Other Literature Sources
Medical
