. 2015 Apr 15;10(4):e0124397.
doi: 10.1371/journal.pone.0124397. eCollection 2015.

Preferential targeting of Nav1.6 voltage-gated Na+ Channels to the axon initial segment during development

Affiliations

Preferential targeting of Nav1.6 voltage-gated Na+ Channels to the axon initial segment during development

Elizabeth J Akin et al. PLoS One. .

Abstract

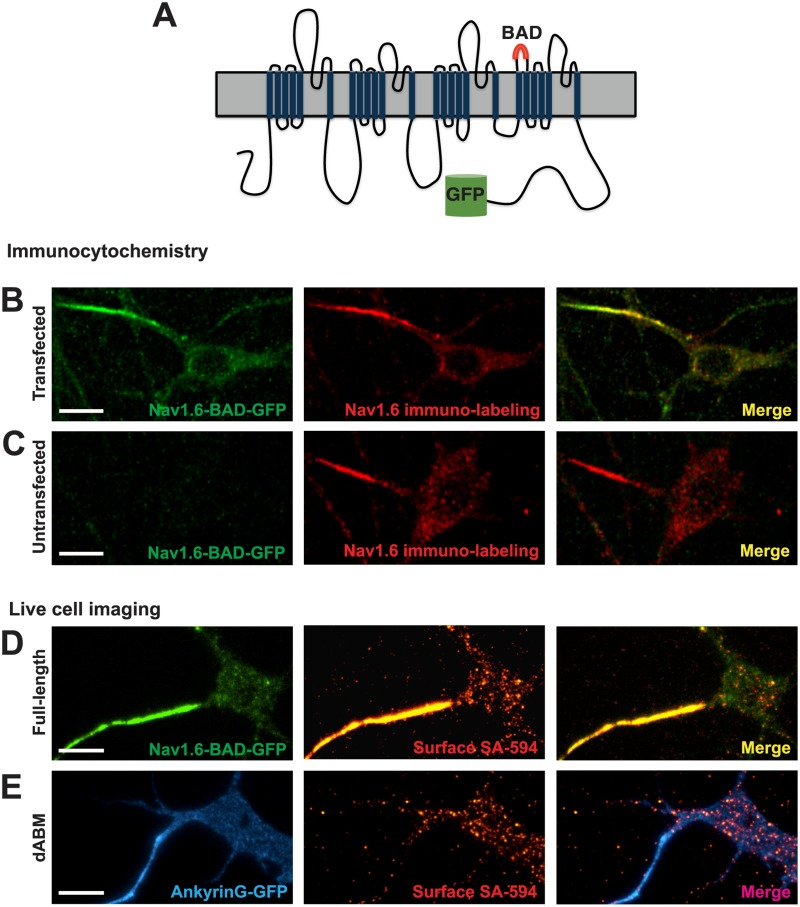
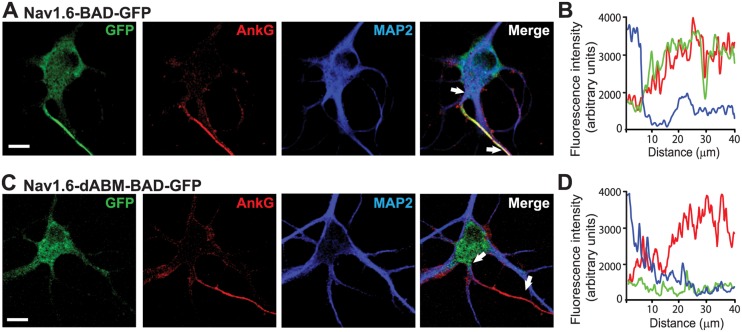
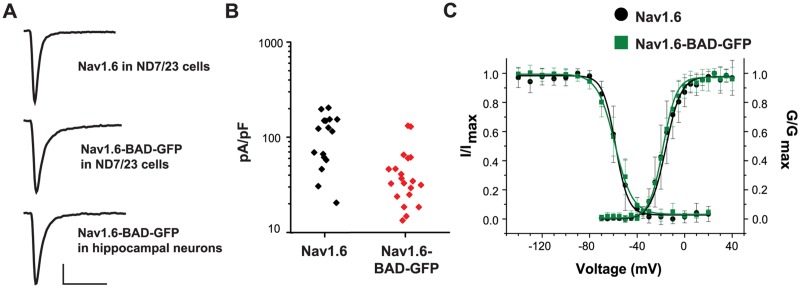
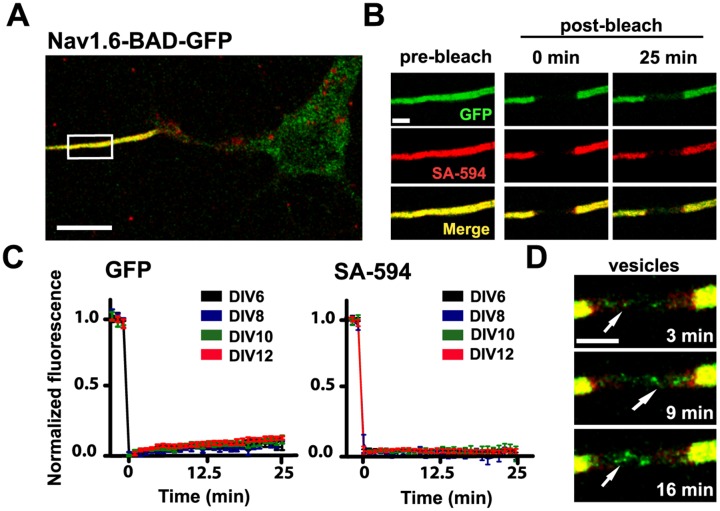
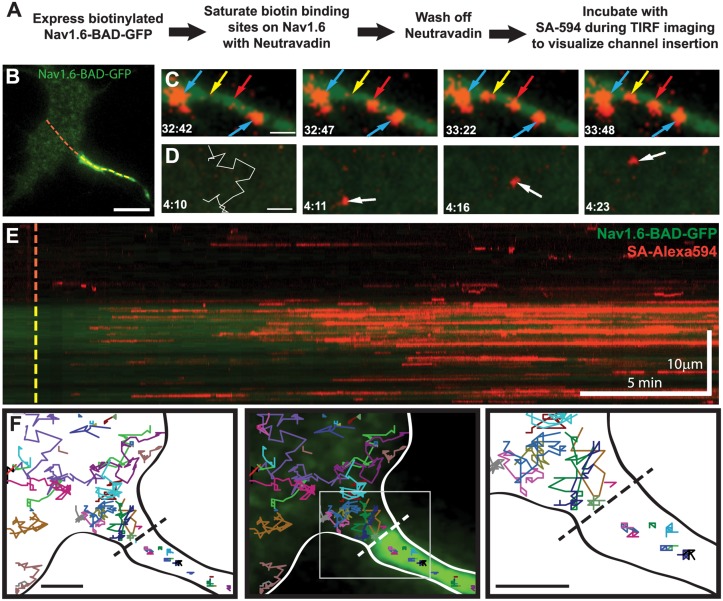
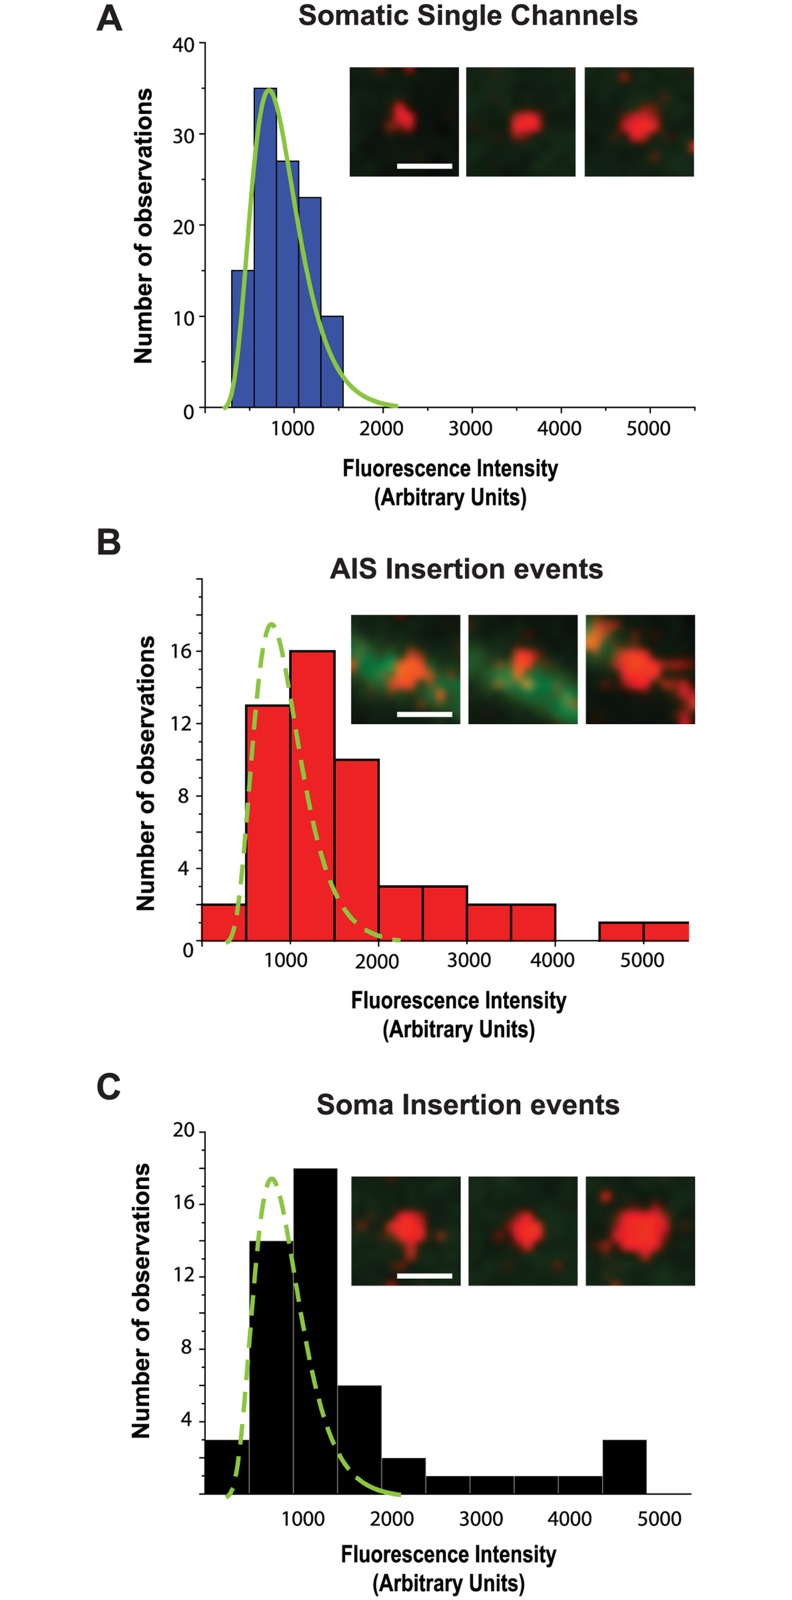
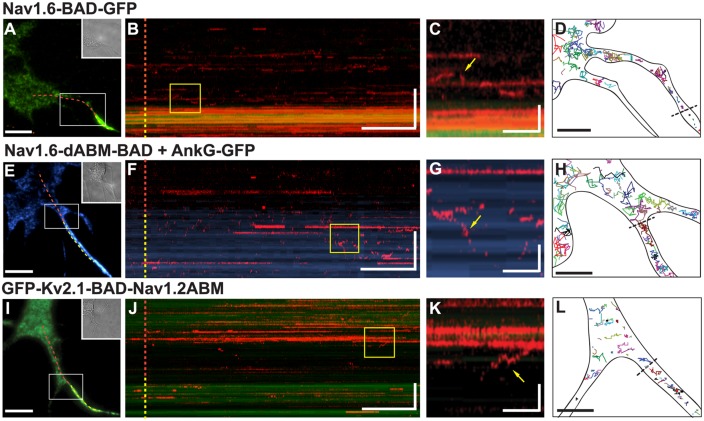
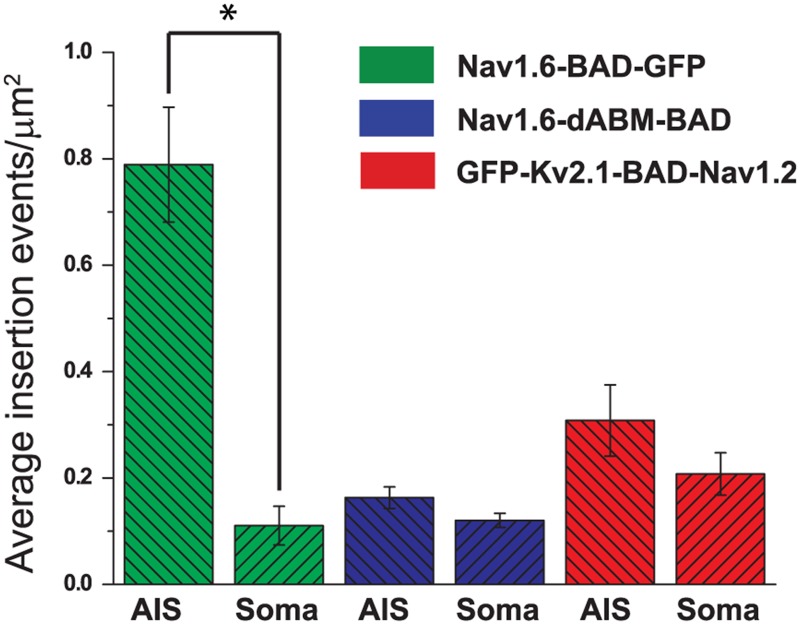
During axonal maturation, voltage-gated sodium (Nav) channels accumulate at the axon initial segment (AIS) at high concentrations. This localization is necessary for the efficient initiation of action potentials. The mechanisms underlying channel trafficking to the AIS during axonal development have remained elusive due to a lack of Nav reagents suitable for high resolution imaging of channels located specifically on the cell surface. Using an optical pulse-chase approach in combination with a novel Nav1.6 construct containing an extracellular biotinylation domain we demonstrate that Nav1.6 channels are preferentially inserted into the AIS membrane during neuronal development via direct vesicular trafficking. Single-molecule tracking illustrates that axonal channels are immediately immobilized following delivery, while channels delivered to the soma are often mobile. Neither a Nav1.6 channel lacking the ankyrin-binding motif nor a chimeric Kv2.1 channel containing the Nav ankyrinG-binding domain show preferential AIS insertion. Together these data support a model where ankyrinG-binding is required for preferential Nav1.6 insertion into the AIS plasma membrane. In contrast, ankyrinG-binding alone does not confer the preferential delivery of proteins to the AIS.


Conflict of interest statement

Competing Interests: The authors have declared that no competing interests exist.

Figures

Fig 1
Fig 1. Nav1.6-BAD-GFP expression mimics that of the endogenous channel in cultured rat hippocampal neurons.
A) Schematic of the Nav1.6-BAD-GFP construct showing location of the biotin acceptor domain (BAD) and fusion of GFP to the channel C-terminus. (B-C) Comparison of anti-Nav1.6 immunolabeling in transfected and untransfected hippocampal neurons. Compressed confocal z-stack of GFP fluorescence (left panel) and anti-Nav1.6 immunolabeling (middle panel) from a Nav1.6-BAD-GFP transfected neuron (B) or a non-transfected neuron (C). Overlay (right panel). Fluorescence intensity of immunolabeling for transfected vs endogenous AIS Nav1.6 expression was not significant (t-test, p = 0.132). (D-E) Surface expression of full-length Nav1.6 or Nav1.6 lacking the ankG-binding motif (ABM) in live neurons visualized by TIRF microscopy. D) Nav1.6-BAD-GFP is highly enriched at the AIS as indicated both by total expressed protein (green) and surface expression (red) visualized by live cell labeling with SA-594. E) Nav1.6-dABM-BAD co-expressed with ankG-GFP (blue) as an axonal marker. Surface channels labeled with SA-594 (red) demonstrated a lack of axonal localization while maintaining a somatic expression pattern similar to the full-length channel. Panels B and C are taken from DIV12 cultures since the endogenous Nav1.6 does not appear until this developmental time. Panels D and E are from DIV8 cultures. Scale bars represent 10 μm.
Fig 2
Fig 2. Nav1.6-BAD-GFP but not Nav1.6-dABM-BAD-GFP co-localizes with axonal markers.
(A,C) Compression of confocal z-stacks of DIV8 rat hippocampal neurons co-transfected with ankG-mCherry and either wild-type Nav1.6-BAD-GFP or Nav1.6-dABM-BAD-GFP and immunolabled for MAP2. A) Nav1.6 is enriched within the ankG positive AIS. B) Line profile of the AIS showing the simultaneous increase of Nav1.6 (green) and ankG (red) and the decrease of MAP2 (blue) with increasing distance from the soma. C) Nav1.6-dABM-BAD-GPF is found throughout the somatodendritic region of the neuron, but is not enriched in the ankG positive AIS. D) Line profile of the AIS showing the increase in ankG (red) while the expression levels of the mutant Nav1.6 (green) and MAP2 (blue) are low within the AIS. Scale bars represent 10 μm.
Fig 3
Fig 3. Nav1.6-BAD-GFP displays wild-type currents.
ND7/23 cells or DIV6 rat hippocampal neurons were transfected with either the wild-type channel or Nav1.6-BAD-GFP and the resulting TTX-resistant currents analyzed by whole-cell voltage-clamp in the presence of 300 nM TTX. A) Representative current traces from the indicated cell type and construct. Scale bars represent 500 pA and 5 ms. B) Summary of current densities for WT and Nav1.6-BAD-GFP expressed in hippocampal neurons. The difference in mean peak current density (116.8±63.06, n = 16 and 48.42±35.73 pA/pF, n = 20,) was significant (p<0.001) although many of the cells expressing the Nav1.6-BAD-GFP channel had expression levels similar to cells expressing the wild-type channel. Currents were recorded 2 days post-transfection. C) Voltage-dependence of fast-inactivation and activation for wild-type Nav1.6 (•) and Nav1.6-BAD-GFP () as measured in ND cells 36–48 hours post-transfection. Error bars are mean ± s.d.
Fig 4
Fig 4. Nav1.6 is stable in the AIS of mature neurons.
A) A representative compressed confocal z-stack of a DIV10 rHN expressing Nav1.6-BAD-GFP. The high density of Nav1.6 in the AIS is labeled both by the GFP fluorescence (green) and by surface labeling of the BAD tag via SA-594 (red). B) Enlargement of the white box in (A) showing fluorescence before photobleaching, immediately after photobleaching and 25 min postbleach. C) Average normalized FRAP curves over 25 min for the GFP fluorescence and surface-specific SA-594 fluorescence. Days post-transfection are indicated. On average, the GFP recovered 7.5±0.2%, n = 8, for DIV6 and 9.7±1.8%, n = 6, for DIV10 mean ± s.e.m.)Images were acquired every minute to minimize photobleaching during the recovery. D) Detection of mobile GFP-containing trafficking vesicles within the bleached AIS. The different time points illustrate the detection of dynamic puncta (arrows) at the indicated postbleach times. Scale bars represent 10 μm (A) or 2 μm (B,D).
Fig 5
Fig 5. Nav1.6-BAD-GFP is delivered along the length of the AIS where it is immediately immobilized.
A) Experimental outline. B) Representative TIRF image and reference for the Kymograph in (E). Dotted line indicates line scan starting in the soma (red) and continuing through the AIS (yellow). C) Representative images of SA-594 labeling of newly inserted channels in the AIS. Two SA-594 puncta appear in the axonal membrane previously devoid of surface labeling (yellow and red arrows), denoting insertion events. Two other puncta are present throughout this time course and show no lateral movement (blue arrows). D) Representative images of SA-594 labeling of newly inserted channels in the soma. The left panel shows the insertion site location (O) and subsequent single-molecule track overlaid on the region prior to the channel delivery at 4:11. E) Kymograph of the line scan shown in (B) indicating GFP (green) and SA-594 (red) fluorescence over time. F) Single-molecule tracking of inserted Nav1.6-BAD-GFP. Each colored line represents an individual track. The black dotted line indicates the soma/AIS boundary. Neurons were transfected on DIV4 and imaged 36–44 hrs post-transfection. Scale bars represent 10 μm (B,E) or 2 μm (C,D,F).
Fig 6
Fig 6. Simultaneous insertion of multiple channels into the plasma membrane.
A) Histogram of fluorescence intensity of SA-594 labeled Nav1.6-BAD-GFP channels on the soma. Solid green line is a fit to the histogram distribution. (B-C) Fluorescence intensity of delivered channels in the AIS and soma, respectively. Dashed green line is the fit to the histogram distribution from panel A. Representative images are shown in the insets. Scale bars represent 1 μm.
Fig 7
Fig 7. AnkyrinG binding is necessary to confer directed delivery to the AIS.
Insertion site experiments were performed as outlined in Fig 4A for hippocampal neurons transfected with either full-length Nav1.6-BAD-GFP (A-D), Nav1.6-dABM-BAD and ankG-GFP (E-H), or GFP-Kv2.1-BAD-Nav1.2ABM (I-L). A,E,I) Reference images for the kymographs with the dotted line indicating the line scan starting in the soma (red) and continuing through the AIS. B,F,J) Kymographs of line scans indicating location of newly inserted channels over time as indicated by SA-594. C,G,K) Enlargements of yellow boxes in kymographs. Immobile channels appear as persistent horizontal lines, while mobile channels are represented by the vertical movements (yellow arrows) in the kymograph or brief appearances as channels cross the line scan. D,H,L) Representative single molecule tracks illustrating channel mobility. The black dotted lines indicate the soma/AIS boundary. Neurons were transfected on DIV4 and imaged 36–44 hrs post-transfection for the Nav1.6 constructs or 12–15 hrs post-transfection for the GFP-Kv2.1-BAD-Nav1.2ABM construct. Scale bars for A,E,I represent 10 μm. Scale bars for B,F,J represent 2 min (horizontal) and 10 μm (vertical). Scale bars for C,G,K represent 15 sec (horizontal) and 3 μm (vertical). Scale bars for D,H,L represent 5 μm.
Fig 8
Fig 8. Summary of insertion events for the AIS versus soma.
Average insertion events for full-length Nav1.6 (694 insertion events from 5 cells), Nav1.6-dABM (265 insertion events from 5 cells), or the Kv2.1-Nav1.2 chimera (618 insertion events from 5 cells). Numbers of insertion events were determined over a 5 min period for each region of the cell, then normalized to the surface area. Data shown as mean values ± s.e.m. Significance was determined using paired t-tests. * indicates p = 0.00194 for Nav1.6-BAD-GFP. The differences for GFP-Kv2.1-BAD-Nav1.2 were not significant, p = 0.2.

References

    1. Kole MH, Ilschner SU, Kampa BM, Williams SR, Ruben PC, Stuart GJ. Action Potential Generation Requires a High Sodium Channel Density in the Axon Initial Segment. Nat Neurosci. 2008. February;11(2):178–86. 10.1038/nn2040 - DOI - PubMed
    1. Isom LL, De Jongh KS, Patton DE, Reber BF, Offord J, Charbonneau H, et al. Primary Structure and Functional Expression of the Beta 1 Subunit of the Rat Brain Sodium Channel. Science. 1992. May 8;256(5058):839–42. . - PubMed
    1. Catterall WA, Goldin AL, Waxman SG. International Union of Pharmacology. Xlvii. Nomenclature and Structure-Function Relationships of Voltage-Gated Sodium Channels. Pharmacol Rev. 2005. December;57(4):397–409. - PubMed
    1. Hu W, Tian C, Li T, Yang M, Hou H, Shu Y. Distinct Contributions of Na(V)1.6 and Na(V)1.2 in Action Potential Initiation and Backpropagation. Nat Neurosci. 2009. August;12(8):996–1002. 10.1038/nn.2359 - DOI - PubMed
    1. Lorincz A, Nusser Z. Cell-Type-Dependent Molecular Composition of the Axon Initial Segment. J Neurosci. 2008. December 31;28(53):14329–40. Pubmed Central PMCID: 2628579. 10.1523/JNEUROSCI.4833-08.2008 - DOI - PMC - PubMed

Publication types

MeSH terms

LinkOut - more resources