. 2015 Nov;38(6):1029-39.
doi: 10.1007/s10545-015-9843-7. Epub 2015 Apr 15.

Untargeted metabolomic analysis for the clinical screening of inborn errors of metabolism

Affiliations

Untargeted metabolomic analysis for the clinical screening of inborn errors of metabolism

Marcus J Miller et al. J Inherit Metab Dis. 2015 Nov.

Erratum in

Abstract

Global metabolic profiling currently achievable by untargeted mass spectrometry-based metabolomic platforms has great potential to advance our understanding of human disease states, including potential utility in the detection of novel and known inborn errors of metabolism (IEMs). There are few studies of the technical reproducibility, data analysis methods, and overall diagnostic capabilities when this technology is applied to clinical specimens for the diagnosis of IEMs. We explored the clinical utility of a metabolomic workflow capable of routinely generating semi-quantitative z-score values for ~900 unique compounds, including ~500 named human analytes, in a single analysis of human plasma. We tested the technical reproducibility of this platform and applied it to the retrospective diagnosis of 190 individual plasma samples, 120 of which were collected from patients with a confirmed IEM. Our results demonstrate high intra-assay precision and linear detection for the majority compounds tested. Individual metabolomic profiles provided excellent sensitivity and specificity for the detection of a wide range of metabolic disorders and identified novel biomarkers for some diseases. With this platform, it is possible to use one test to screen for dozens of IEMs that might otherwise require ordering multiple unique biochemical tests. However, this test may yield false negative results for certain disorders that would be detected by a more well-established quantitative test and in its current state should be considered a supplementary test. Our findings describe a novel approach to metabolomic analysis of clinical specimens and demonstrate the clinical utility of this technology for prospective screening of IEMs.


Figures

Fig. 1
Fig. 1
Overview of metabolomic results. a The total number of analytes identified for each class of biochemicals is shown. Overlapping black bars indicate the number of analytes identified in 90 % or more of the 190 patient samples tested. The number of unique endogenous analytes were calculated for IEM and undiagnosed patient populations: b Boxplots indicate total analyte identifications; c total number of analytes with a z-score >2 or < −2. Metabolomic data for patient #1051 with methylmalonyl mutase deficiency (MMA) are shown in d and e. d All endogenous analyte z-scores were plotted in ranked order; only a subset of significant analytes are named in the plot. e Analyte z-score findings for patient #1051 were overlaid onto the branch chain amino acid (BCAA) degradation pathway affected in MMA patients. Each node represents a single metabolic step. Filled numbered circles show z-scores for significant analyte findings and the size of the circle is proportionate to the z-score with red dots representing positive z-scores and blue dots negative z-scores. Black dots represent analytes with a z-score that was not significant; open circles indicate analytes not identified by this analysis. The pathway position of the enzymatic deficiency, methylmalonyl mutase, is indicated by a black star. Multiple findings are indicated for some nodes due to the production of conjugated metabolites (e.g., excess propionyl-CoA is converted to propionylcarnitine and propionylglycine). Full BCAA pathway annotation and a more comprehensive example of patient findings related to this pathway can be found in Fig. S5
Fig. 2
Fig. 2
Comprehensive pathway analysis provides useful diagnostic information for branched chain amino acid metabolism. Bar charts are shown for a representative subset of metabolites in the branched chain amino acid pathway. Values are given as z-scores (y-axis) and dashed gray lines indicate clinically relevant z-score cutoffs (>2 or < −2). Each bar represents a unique patient specimen, and each color represents the patient’s diagnosis (blue = methylmalonic aciduria, yellow = cobalamin biosynthesis disorders, red = propionyl CoA carboxylase deficiency, purple = HMG CoA lyase deficiency, orange = 3-methylcrotonyl CoA carboxylase deficiency, black = isovaleryl CoA dehydrogenase deficiency, and green = branched-chain ketoacid dehydrogenase deficiency). For each disorder, a colored diamond pinpoints the pathway position of the deficient enzyme. Numbered circles indicate intermediate analytes, 1 3-methyl-2-oxobutyrate, 2 isobutryl-CoA, 3 methylacrylyl-CoA, 4 3-OH-isobutryl-CoA, 5 methylmalonic semialdehyde, 6 3-methyl-2-oxovalerate, 7 2-methylbutyryl-CoA, 8 tiglyl-CoA, 9 2-methyl-3-OH-butyryl-CoA, 10 2-methylacetoacetyl-CoA, 11 4-methyl-2-oxopentanoate, 12 isovaleryl-CoA, 13 3-methylcrotonyl CoA, 14 3-methylglutaconyl CoA, 15 3-OH-3-methylglutaryl-CoA, 16 propionyl-CoA, 17 acetyl-CoA, 18 methylcitrate, and 19 methylmalonyl-CoA. As with standard clinical testing, many CoA conjugated pathway intermediates listed here are assayed through the measurement of carnitine or glycine conjugated forms
Fig. 3
Fig. 3
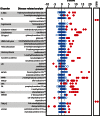
Representative examples of clinically relevant findings for each inborn error of metabolism evaluated in this study. Each dot represents a unique patient (normal = hollow blue circles and IEM patient = filled red circles). “Rare analyte” refers to analytes only detected in the indicated patients. See Supplemental Tables 1 and 2 for a full listing of clinically relevant findings for each disorder. See Table 1 for the full name for each disorder
Fig. 4
Fig. 4
Arginase deficiency reveals significant perturbations in distal pathways. The green diamond indicates the location of arginase, the deficient enzyme in these patients. Values are given as z-scores (y-axis) and dashed gray lines indicate clinically relevant z-score cutoffs (>2 or < −2). Patients 1–4 correspond to patient #1006–1009, respectively, in Supplemental Table 1. Pathway intermediates are indicated by numbered circles, 1 arginine, 2 argininosuccinate, 3 citrulline, 4 ornithine, 5 carbamoylphosphate, 6 orotate, 7 uridine, 8 uracil, 9 dihydrouracil, 10 3-ureidopropionate, 11 homoarginine, 12 homoargininosuccinate, and 13 homocitrulline

References

    1. Burton BK. Inborn errors of metabolism in infancy: a guide to diagnosis. Pediatrics. 1998;102(6):E69. doi: 10.1542/peds.102.6.e69. - DOI - PubMed
    1. Dehaven CD, Evans AM, Dai H, Lawton KA. Organization of GC/MS and LC/MS metabolomics data into chemical libraries. J Cheminform. 2010;2(1):9. doi: 10.1186/1758-2946-2-9. - DOI - PMC - PubMed
    1. Denes J, Szabo E, Robinette SL, et al. Metabonomics of newborn screening dried blood spot samples: a novel approach in the screening and diagnostics of inborn errors of metabolism. Anal Chem. 2012;84(22):10113–10120. doi: 10.1021/ac302527m. - DOI - PubMed
    1. Evans AM, DeHaven CD, Barrett T, Mitchell M, Milgram E. Integrated, nontargeted ultrahigh performance liquid chromatography/electrospray ionization tandem mass spectrometry platform for the identification and relative quantification of the small-molecule complement of biological systems. Anal Chem. 2009;81(16):6656–6667. doi: 10.1021/ac901536h. - DOI - PubMed
    1. Frick B, Schrocksnadel K, Neurauter G, Wirleitner B, Artner-Dworzak E, Fuchs D. Rapid measurement of total plasma homocysteine by HPLC. Clin Chim Acta. 2003;331(1–2):19–23. doi: 10.1016/S0009-8981(03)00076-7. - DOI - PubMed

Publication types