Review
. 2015 Apr 14;7(4):1273-302.
doi: 10.3390/toxins7041273.

Genetics, genomics and evolution of ergot alkaloid diversity

Affiliations
Review

Genetics, genomics and evolution of ergot alkaloid diversity

Carolyn A Young et al. Toxins (Basel). .

Abstract

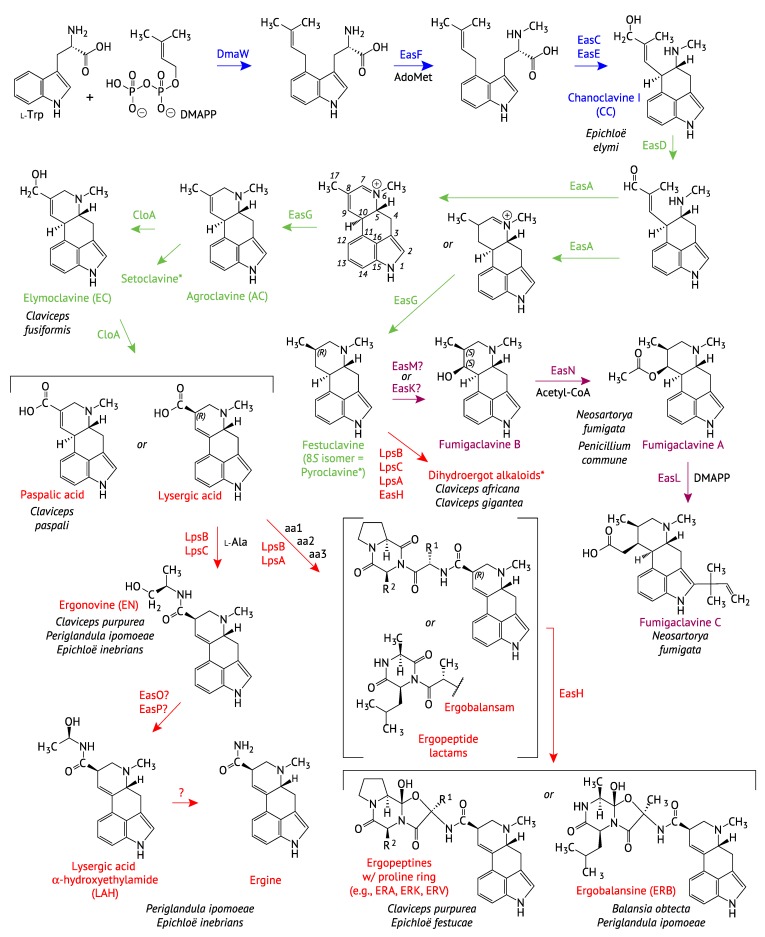
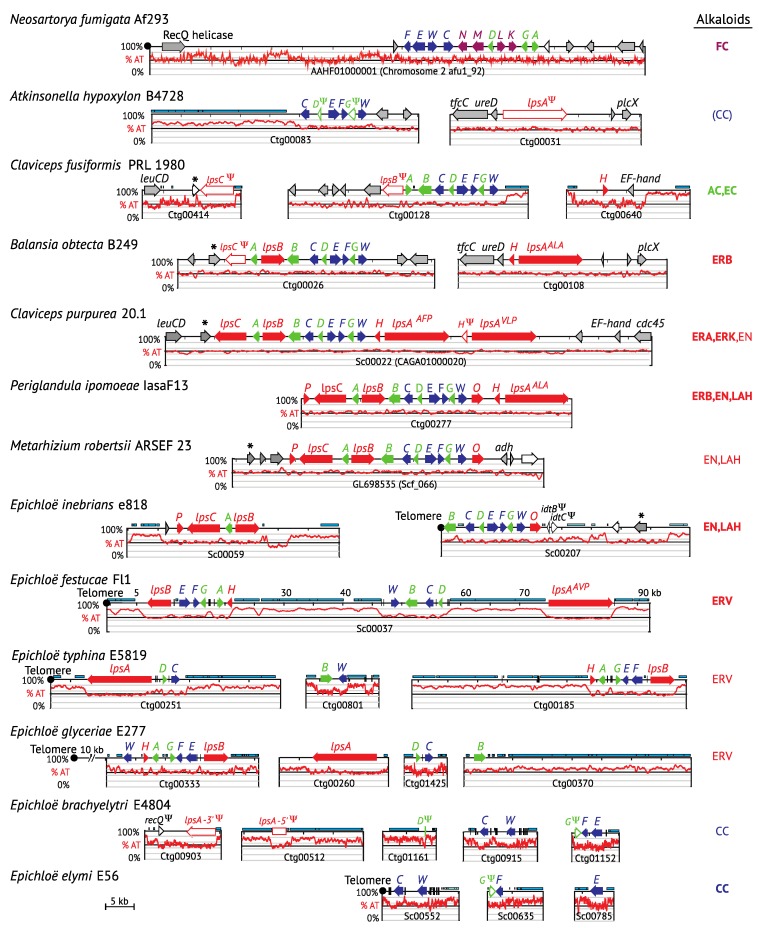
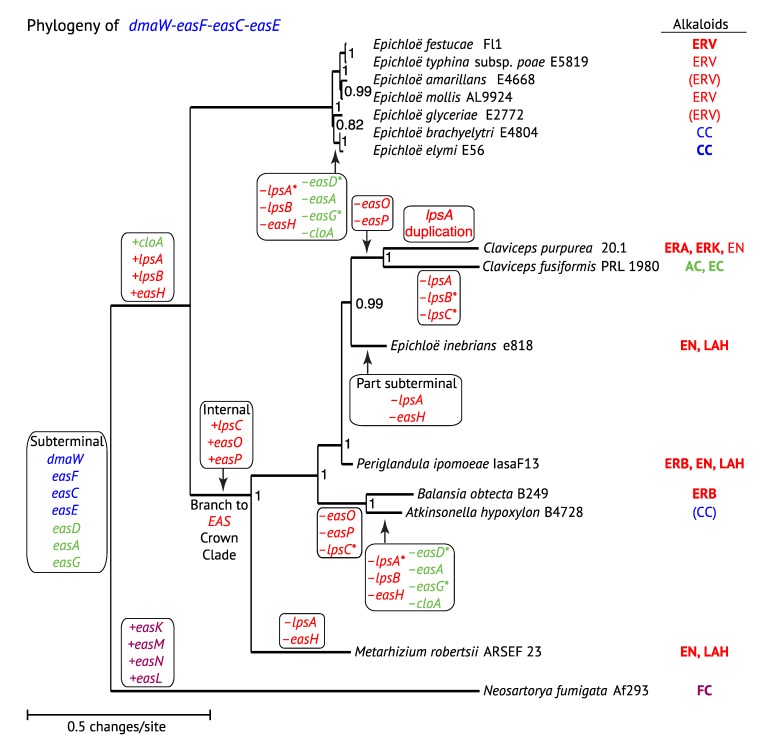
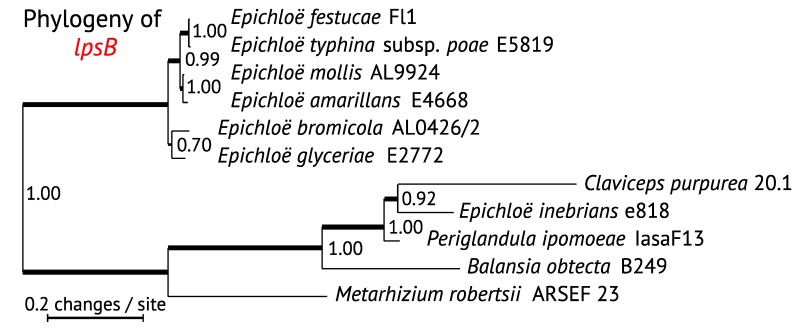
The ergot alkaloid biosynthesis system has become an excellent model to study evolutionary diversification of specialized (secondary) metabolites. This is a very diverse class of alkaloids with various neurotropic activities, produced by fungi in several orders of the phylum Ascomycota, including plant pathogens and protective plant symbionts in the family Clavicipitaceae. Results of comparative genomics and phylogenomic analyses reveal multiple examples of three evolutionary processes that have generated ergot-alkaloid diversity: gene gains, gene losses, and gene sequence changes that have led to altered substrates or product specificities of the enzymes that they encode (neofunctionalization). The chromosome ends appear to be particularly effective engines for gene gains, losses and rearrangements, but not necessarily for neofunctionalization. Changes in gene expression could lead to accumulation of various pathway intermediates and affect levels of different ergot alkaloids. Genetic alterations associated with interspecific hybrids of Epichloë species suggest that such variation is also selectively favored. The huge structural diversity of ergot alkaloids probably represents adaptations to a wide variety of ecological situations by affecting the biological spectra and mechanisms of defense against herbivores, as evidenced by the diverse pharmacological effects of ergot alkaloids used in medicine.


Figures

Figure 1
Figure 1
The ergot alkaloid pathway showing steps that result in diversification of compounds. Pathway steps are color-coded based on the position or diversification within the pathway, Blue = early steps to the intermediate chanoclavine, Green = mid steps leading to the tetracyclic clavines, Red = late steps represented by the lysergic acid amides and the complex ergopeptines, Purple = steps to fumigaclavines produced by Trichocomaceae.
Figure 2
Figure 2
Relative adenine and thymine (%AT) DNA content of ergot alkaloid synthesis (EAS) loci. Gene name abbreviations are as follow: all eas genes = last letter, cloA = B and dmaW = W. Gene names are colored to represent the stage of the pathway for the encoded product (see Figure 1). Pseudogenes are represented by Ψ and white-filled arrows. The major pathway end product of each strain is indicated on the right in bold face (product produced) or regular type (product predicted but not yet tested), or in parentheses (product predicted but undetected). Arrows marked with * represent orthologues of C. purpurea AET79176 (GenBank). Cyan bars indicate repeats, and vertical black bars indicate miniature inverted-repeat transposable elements (MITEs). Where present, telomeres are positioned at left.
Figure 3
Figure 3
Phylogeny of concatenated dmaW-easF-easC-easE genes. The phylogenetic tree is based on a nucleotide alignment of coding sequences of the core genes for the first four steps in ergot alkaloid biosynthesis available from sequenced genomes. Sequences were aligned with MUSCLE [41], and trees were inferred by maximum likelihood with PhyML implemented by Phylogeny.fr [40]. Node support was determined by the approximate likelihood ratio test [42]. Gene gains and loses are indicated by + and –, respectively, and asterisks (*) indicate that remnants or pseudogenes can be found in one or more members of the clade. Genes are color-coded based on position of the encoded step within the pathway. The major pathway end product of each strain is indicated on the right in bold face (product produced) or regular type (product predicted but not yet tested), or in parentheses (product predicted but undetected).
Figure 4
Figure 4
Phylogeny of lysergyl peptide synthetase subunit 2 (lpsB). The phylogenetic tree was inferred by maximum likelihood on a nucleotide alignment of coding sequences. Methods are as in Figure 3. The left edge is placed to correspond to the root inferred in Figure 3 with Neosartorya fumigata EAS genes as the outgroup; N. fumigata lacks lpsB.
Figure 5
Figure 5
Phylogeny of tefA, encoding translation elongation factor 1-α. The phylogenetic tree inferred by maximum likelihood on a nucleotide alignment of coding sequences. Methods are as in Figure 3.
Figure 6
Figure 6
Phylogeny of the Lps subunit AMPylation domains. The phylogenetic tree was inferred by maximum likelihood on a nucleotide alignment of coding sequences. Methods are as in Figure 3. The specified substrates are given in parentheses as LA = lysergic acid, dihyroLA = dihydrolysergic acid, and standard abbreviations for common l-amino acids. The LpsA superscripts indicate single-letter codes for the amino acids specified by AMPylation domains of module 1, 2 and 3 (A1, A2 and A3), respectively. Functionality and specificity of M. robertsii LpsB and LpsC are unknown. The P. ipomoeae EAS cluster is shown at right with Lps genes and modules color-coded.
Figure 7
Figure 7
Remaining EAS genes and pseudogenes after independent losses in two E. bromicola isolates, AL0434 and AL0426/2. The AT-GC DNA contents are shown under the maps. Pseudogenes are represented by Ψ.
Figure 8
Figure 8
Phylogeny of dmaW genes of Epichloë strains. The phylogenetic tree was inferred by maximum likelihood on a nucleotide alignment of coding sequences. Methods are as in Figure 3. The dmaW alleles are distinguished in hybrids that possess more than one copy with a letter that refers to the ancestral progenitor (a = E. amarillans, b = E. baconii-related Lolium associated Epichloë subclade, e = E. elymi, f = E. festucae, m = E. mollis-related and p = E. typhina subsp. poae. The dmaW gene of E. inebrians has been omitted in this analysis because the gene and EAS locus is more similar to that of P. ipomoeae than to those of other Epichloë species (see Figure 3).
Figure 9
Figure 9
Structures of the EAS clusters from two E. coenophiala strains, e19 and e4163. The AT-GC contents are shown under the maps. Gene names are abbreviated as in Figure 2.
Figure 10
Figure 10
Structures of representative EAS loci showing synteny of EAS genes between species. Genes are colored to represent the stage of the pathway for the encoded product (see Figure 1 and Figure 2). Pseudogenes are represented by Ψ and white-filled arrows. Gray polygons link orthologous genes and gene blocks but are not meant to imply particular phylogenetic relationships. The EAS crown clade includes clusters from At. hypoxylon, B. obtecta, C. purpurea, C. fusiformis and P. ipomoeae.
Figure 11
Figure 11
Gene map showing dmaW and easF paralogues in the region flanking the EAS locus from C. purpurea strain 20.1. The genes for recQ helicase and paralogues of dmaW and easF are shown in black, and the genes pertaining to the EAS cluster are color-coded based on position of the encoded step within the pathway. For other genes, the locus_tag names (GenBank) are CPUR_04108, CPUR_04107, etc., where only the last four digits are shown. Names of EAS genes are abbreviated as in Figure 2.

References

    1. Billings M. The Crusades: Five Centuries of Holy Wars. Sterling Publishing Company; New York, NY, USA: 1996.
    1. Alm T. The witch trials of Finnmark, northern Norway, during the 17th century: Evidence for ergotism as a contributing factor. Econ. Bot. 2003;57:403–416. doi: 10.1663/0013-0001(2003)057[0403:TWTOFN]2.0.CO;2. - DOI
    1. Caporael L.R. Ergotism: the Satan loosed in Salem? Science. 1976;192:21–26. doi: 10.1126/science.769159. - DOI - PubMed
    1. Woolf A. Witchcraft or mycotoxin? The Salem witch trials. J. Toxicol.: Clin. Toxicol. 2000;38:457–460. doi: 10.1081/CLT-100100958. - DOI - PubMed
    1. Zadoks J.C. On the Political Economy of Plant Disease Epidemics: Capita Selecta in Historical Epidemiology. Wageningen Academic Publishers; Wageningen, The Netherlands: 2008.

Publication types

Substances