. 2015 Apr 15;11(4):e1005147.
doi: 10.1371/journal.pgen.1005147. eCollection 2015 Apr.

Systematic dissection of the sequence determinants of gene 3' end mediated expression control

Affiliations

Systematic dissection of the sequence determinants of gene 3' end mediated expression control

Ophir Shalem et al. PLoS Genet. .

Abstract

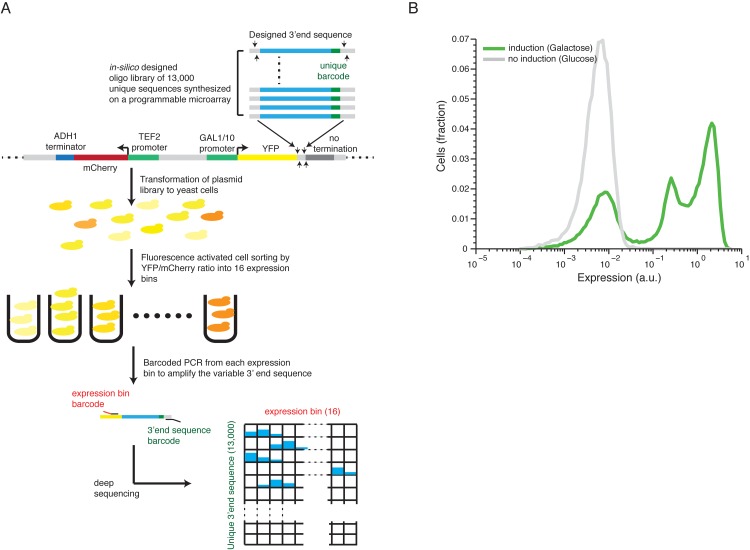
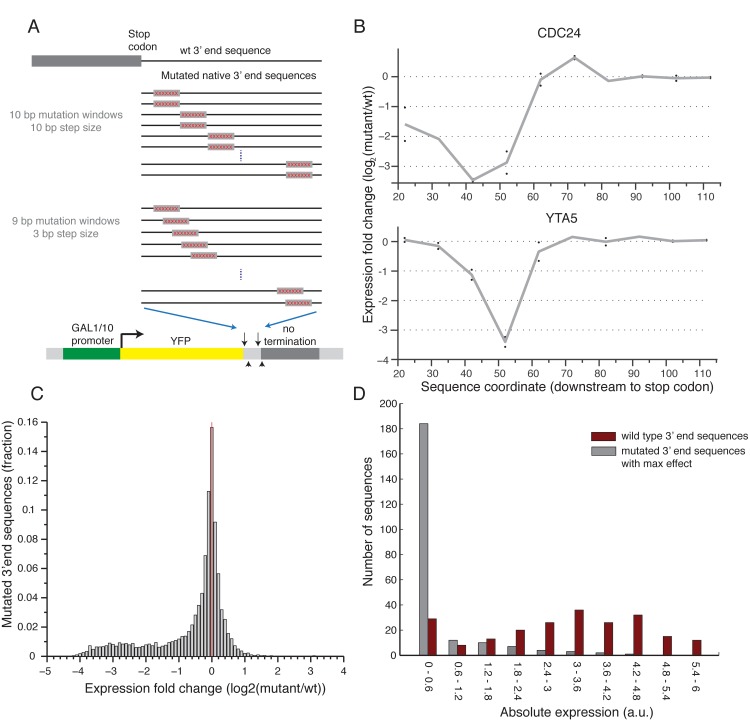
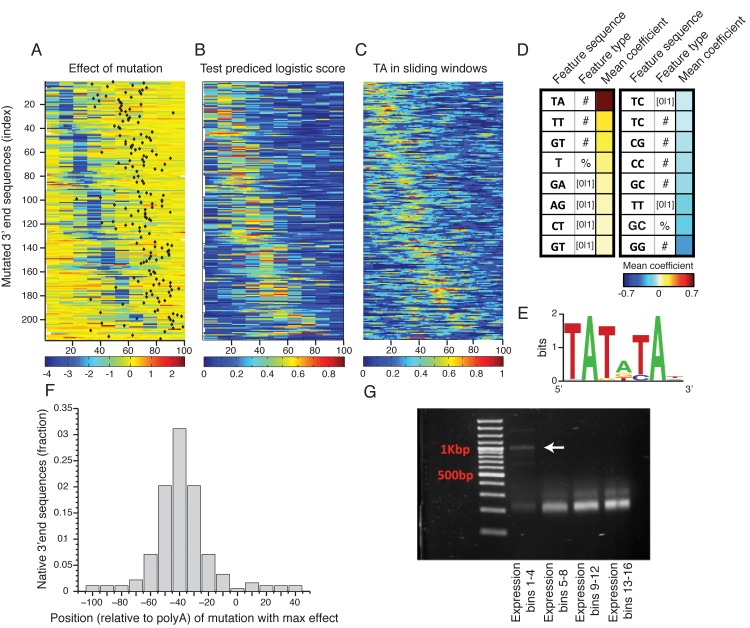
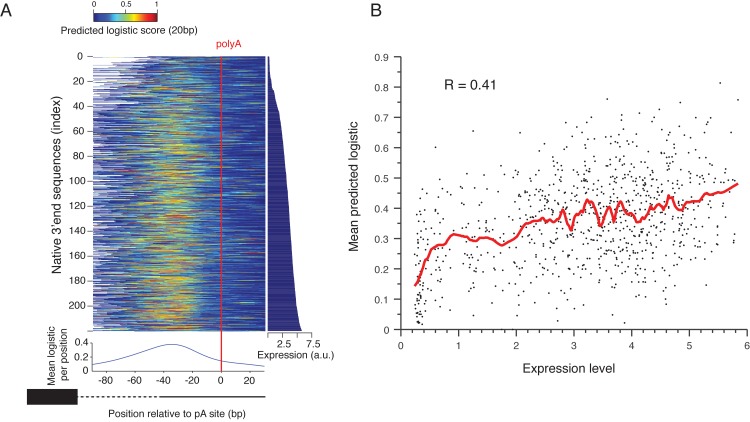
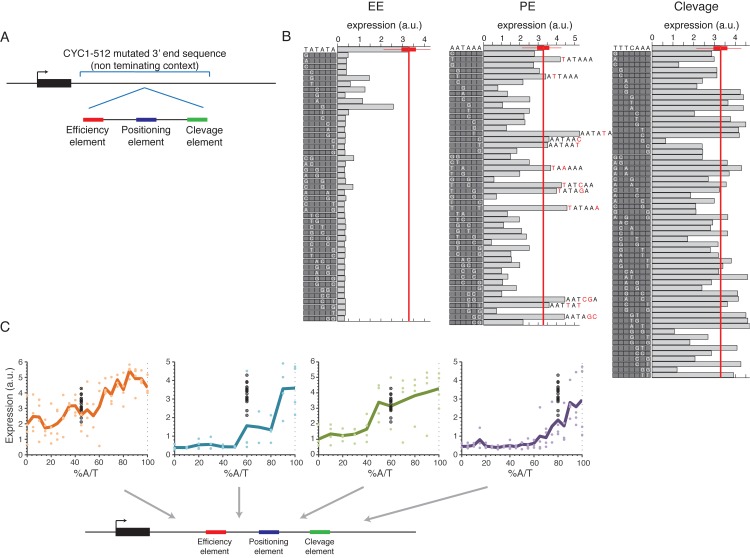
The 3'end genomic region encodes a wide range of regulatory process including mRNA stability, 3' end processing and translation. Here, we systematically investigate the sequence determinants of 3' end mediated expression control by measuring the effect of 13,000 designed 3' end sequence variants on constitutive expression levels in yeast. By including a high resolution scanning mutagenesis of more than 200 native 3' end sequences in this designed set, we found that most mutations had only a mild effect on expression, and that the vast majority (~90%) of strongly effecting mutations localized to a single positive TA-rich element, similar to a previously described 3' end processing efficiency element, and resulted in up to ten-fold decrease in expression. Measurements of 3' UTR lengths revealed that these mutations result in mRNAs with aberrantly long 3'UTRs, confirming the role for this element in 3' end processing. Interestingly, we found that other sequence elements that were previously described in the literature to be part of the polyadenylation signal had a minor effect on expression. We further characterize the sequence specificities of the TA-rich element using additional synthetic 3' end sequences and show that its activity is sensitive to single base pair mutations and strongly depends on the A/T content of the surrounding sequences. Finally, using a computational model, we show that the strength of this element in native 3' end sequences can explain some of their measured expression variability (R = 0.41). Together, our results emphasize the importance of efficient 3' end processing for endogenous protein levels and contribute to an improved understanding of the sequence elements involved in this process.


Conflict of interest statement

ZY is an employee of and owns stocks in Agilent Technologies. Other authors have declared that no competing interests exist.

Figures

Fig 1
Fig 1. Illustration of our method and overall expression distribution.
(A) 13,000 designed synthetic sequences were ligated into a low copy plasmid (top part). The plasmid pool was then transformed into yeast to create a heterogeneous pool of yeast cells each expressing YFP to a different level corresponding to one of the unique 13,000 cloned 3’ end sequences. The cells were then sorted using fluorescence activated sorting (FACS) into 16 expression bins by the YFP/mCherry ratio (middle). Next, the reporter 3’ end sequences of cells in each bin were amplified, using bar coded primers for each bin, and sequence barcodes was recovered using next-generation sequencing (NGS). Finally, each sequencing read was mapped to a specific 3’ end sequence and a specific bin (bottom) to achieve the distribution of cells with each synthetic 3’ end sequence across the expression bins. The distribution of each construct was fit to a gamma distribution and the mean expression value was inferred based on this fit. (B) The distribution of library expression values in induced and un-induced promoter states. The induced state displays a tri-modal distribution with 3 peaks corresponding to (1) non-induced promoter state (2) induced promoter state and low expressing 3’ end sequences and (3) induced promoter state with a wide range of 3’ end mediated expression.
Fig 2
Fig 2. Scanning mutagenesis of native 3’ end sequences reveals critical elements required to maintain expression.
(A) Illustration of the two scanning mutagenesis strategies used, in the upper panel two 10bp mutation windows were designed with non-overlapping 10bp steps. In the lower panel 9bp mutation windows were designed with overlapping 3bp steps. (B) Profile of the effect of mutations as a function of location for two genes: CDC24 and YTA5. Y-axis shows the expression log2 fold change compared to the wild type sequence with each point representing a single 10bp mutation window centered around the corresponding x-axis value relative to the stop codon. The gray line connects the average of each pair of mutations. (C) Distribution of log2 fold ratio between mutated and wild type 3’ end sequences showing a highly skewed distribution towards negative values. (D) Distribution of absolute expression values (a.u.) for non-mutated native 3’ end sequences (dark red) and mutated 3’ end sequences (gray). For the mutated sequences, the mutation that resulted in the largest reduction in expression was chosen for each native sequence.
Fig 3
Fig 3. Sequence determinants of 3’ end functional elements.
(A) Heat map showing the mean effect of a mutation as a function of location in the 3’ end sequence. Each row represents one sequence and the color represents the mean expression fold change across two replicates between the mutated and wild type sequences. Rows are sorted by the location of the maximal affecting mutation. (B) Heat map of predicted logistic values on a held-out test set (see main text and methods). Location of subsequences correspond to those in Fig 3A. (C) Frequency of AT dinucleotide, highest weighted feature in the inferred model, in sliding windows of 20bp. Location of subsequences correspond to those in Fig 3A. (D) Table of the features that contribute most to the classification. Color represents the mean coefficient across the 10 cross validation partitions. For each possible mono/di-nucleotide three types of features were considered: ‘[0|1]’ – a binary feature that is one if the specified mono/di-nucleotide occurs at least once in the sequence and zero otherwise, ‘#’ – a counter of the number that the specified mono/di-nucleotide occurs in the sequence. ‘%’ percent of nucleotides of the sequence that are part of an occurrence of the specified mono/di-nucleotide. (E) DNA sequence motif found to be enriched in the positive subsequence instances. (F) Distribution of distances between the location (center) of the mutation that resulted in the maximal reduction in expression and the location of the main polyadenylation site for the wild type sequence. (G) Results of YFP specific 3’ RACE, where each lane represents 4 expression bins. Lowest lane displays long aberrant 3’UTRs not apparent in the higher expression bins.
Fig 4
Fig 4. Prediction of polyadenylation signals in native sequences.
(A) Native sequences are aligned by the main polyadenylation site and ordered by the expression values (right panel). The color indicates the predicted logistic values using the classifier learned on the scanning mutagenesis set. The lower panel shows the mean predicted logistic in a 20bp sliding window (centered) relative to the polyadenylation site. (B) Mean predicted logistic in a 20 bp window, centered around the peak from Fig 4A on the y-axis versus expression levels in the x-axis. The red line shows a smoothing line with 50 instances window.
Fig 5
Fig 5. Systematic mutagenesis of a designed synthetic terminator.
(A) Illustration of the construct design: a minimal terminator sequence was embedded within a mutated non-terminating 3’ end sequence from the CYC1-512 3’ end region. (B) All possible single bp mutations in the three elements EE, PE and cleavage on the left, middle and right panels, respectively. Boxes on the left of each panel show the mutated sequences with a highlighted white letter representing the location and exact mutation relative to the wild type sequence shown on the top. Bars show the expression value of each sequence. (C) Expression as a function of context A/T content. Each point represents a mutated sequence with A/T content of the relevant sequence region on the x-axis and expression on the y-axis. Black points show the expression of the non-mutated sequence with different barcodes. Mutated regions are: (1) upstream to EE (2) between EE to PE (3) between PE to cleavage and (4) downstream to cleavage, corresponding to the panels from left to right.

References

    1. Jackson JS, Houshmandi SS, Lopez Leban F, Olivas WM. Recruitment of the Puf3 protein to its mRNA target for regulation of mRNA decay in yeast. RNA. 2004;10: 1625–36. 10.1261/rna.7270204 - DOI - PMC - PubMed
    1. Shalgi R, Lapidot M, Shamir R, Pilpel Y. A catalog of stability-associated sequence elements in 3’ UTRs of yeast mRNAs. Genome Biol. 2005;6: R86 10.1186/gb-2005-6-10-r86 - DOI - PMC - PubMed
    1. Foat BC, Houshmandi SS, Olivas WM, Bussemaker HJ. Profiling condition-specific, genome-wide regulation of mRNA stability in yeast. Proc Natl Acad Sci U S A. 2005;102: 17675–80. 10.1073/pnas.0503803102 - DOI - PMC - PubMed
    1. Hammell CM, Gross S, Zenklusen D, Heath C V, Stutz F, Moore C, et al. Coupling of termination, 3’ processing, and mRNA export. Mol Cell Biol. 2002;22: 6441–57. Available: http://www.pubmedcentral.nih.gov/articlerender.fcgi?artid=135649&tool=pm... - PMC - PubMed
    1. Birse CE, Minvielle-Sebastia L, Lee BA, Keller W, Proudfoot NJ. Coupling termination of transcription to messenger RNA maturation in yeast. Science. 1998;280: 298–301. Available: http://www.ncbi.nlm.nih.gov/pubmed/9535662 - PubMed

Publication types

LinkOut - more resources