. 2015 Apr 13;11(4):e1005149.
doi: 10.1371/journal.pgen.1005149. eCollection 2015 Apr.

Spastin binds to lipid droplets and affects lipid metabolism

Affiliations

Spastin binds to lipid droplets and affects lipid metabolism

Chrisovalantis Papadopoulos et al. PLoS Genet. .

Abstract

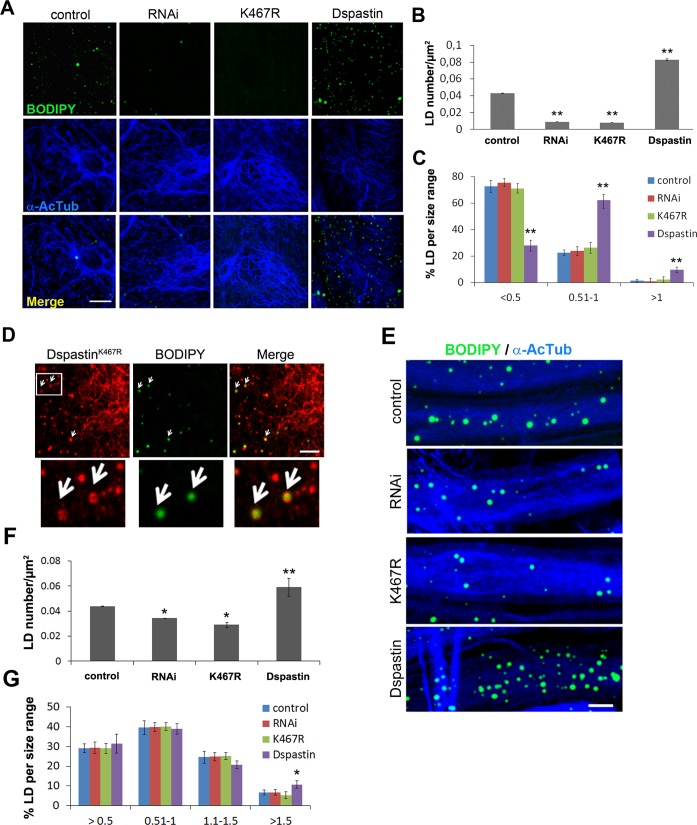
Mutations in SPAST, encoding spastin, are the most common cause of autosomal dominant hereditary spastic paraplegia (HSP). HSP is characterized by weakness and spasticity of the lower limbs, owing to progressive retrograde degeneration of the long corticospinal axons. Spastin is a conserved microtubule (MT)-severing protein, involved in processes requiring rearrangement of the cytoskeleton in concert to membrane remodeling, such as neurite branching, axonal growth, midbody abscission, and endosome tubulation. Two isoforms of spastin are synthesized from alternative initiation codons (M1 and M87). We now show that spastin-M1 can sort from the endoplasmic reticulum (ER) to pre- and mature lipid droplets (LDs). A hydrophobic motif comprised of amino acids 57 through 86 of spastin was sufficient to direct a reporter protein to LDs, while mutation of arginine 65 to glycine abolished LD targeting. Increased levels of spastin-M1 expression reduced the number but increased the size of LDs. Expression of a mutant unable to bind and sever MTs caused clustering of LDs. Consistent with these findings, ubiquitous overexpression of Dspastin in Drosophila led to bigger and less numerous LDs in the fat bodies and increased triacylglycerol levels. In contrast, Dspastin overexpression increased LD number when expressed specifically in skeletal muscles or nerves. Downregulation of Dspastin and expression of a dominant-negative variant decreased LD number in Drosophila nerves, skeletal muscle and fat bodies, and reduced triacylglycerol levels in the larvae. Moreover, we found reduced amount of fat stores in intestinal cells of worms in which the spas-1 homologue was either depleted by RNA interference or deleted. Taken together, our data uncovers an evolutionarily conserved role of spastin as a positive regulator of LD metabolism and open up the possibility that dysfunction of LDs in axons may contribute to the pathogenesis of HSP.


Conflict of interest statement

The authors have declared that no competing interests exist.

Figures

Fig 1
Fig 1. Spastin-M1 binds to LDs.
Z-stack images of HeLa cells expressing mCherry-spastin-M1 untreated (A) or treated with OA overnight (B). LDs were labeled by BODIPY 493/503, by anti-PLIN2 antibody, or by co-expression of GFP-PLIN2 or GFP-PLIN3. Anti-calnexin antibody was used to label the ER. Enlargements of boxed areas are shown. Scale bar, 10 μm. (C) HeLa cells expressing Flag-spastin-M1 were treated with OA overnight. The cell lysate was subjected to sucrose gradient centrifugation and fractions from top (LD) to bottom (2–6) and the pellet (P) were analyzed by immunoblotting with the indicated antibodies. The whole LD fraction and a fifth of the other fractions were loaded on the gel. PLIN3 was used as a marker of LDs, calnexin as a marker of the ER. (D) HeLa cells transfected with mCherry-spastin-M1 were followed by time-lapse microscopy every hour, starting 8 hours after transfection (see scheme below). At early time-point of expression spastin-M1 decorates LDs present in the cell and then localizes to different compartments. Images are individual Z-stacks. Enlargement of boxed areas are shown. Scale bar, 11 μm.
Fig 2
Fig 2. Spastin-M1 co-localizes with the pre-LD marker Hpos.
COS7 cells co-expressing mCherry (A), mCherry-spastin-M1 (B) or mCherry-spastin-M87 (C) with GFP-HPos were starved overnight (24h stv) or additionally incubated with OA (24h stv, 24h OA). Spastin-M1 is present in HPos positive puncta upon starvation, and forms rings together with HPos after OA loading. Spastin-M87 does not co-localize with pre-LDs or mature LDs. Images are individual Z-stacks. Enlargements of boxed areas are shown. Scale bar, 10 μm.
Fig 3
Fig 3. Identification of spastin LD-targeting motif.
(A) HeLa cells were transfected with mCherry-spastin-M87, or spastin-Δ50-myc, as indicated, and were treated with OA overnight. LDs were visualized with BODIPY 493/503. Spastin-Δ50 was detected using an anti-myc antibody. (B) Schematic representation of the hydrophobic region (highlighted in gray) and the following positive stretch in spastin-M1 with positively charged residues indicated in red. (C) HeLa cells were transfected with TM-mCherry, TM-R65G-mCherry, and TM-R81/84G-mCherry constructs, as indicated, and incubated in the presence of OA overnight. LDs were stained with BODIPY 493/503. The region of spastin from amino acids 57 to 86 is sufficient and necessary for LD targeting, which is abolished by mutating R65. Images are individual Z-stacks. An enlargement of the boxed area is shown. Scale bars, 10 μm.
Fig 4
Fig 4. Spastin-M1 affects LD size and distribution.
(A) HeLa cells expressing mCherry-spastin-M1, mCherry-spastin-M87, mCherry-spastin-ΔMBD or mCherry alone were incubated with OA overnight. LDs were stained with BODIPY 493/503. Merged projection images are shown. Scale bar, 10 μm. Arrows indicate transfected cells. (B-D) Quantification of the total volume of LDs (B), total LD number (C), and average LD volume per cell (D) are plotted for each transfected construct. (E) Transfected cells with each construct were classified according to the distribution of their LDs. Results are given as means ± SEM from three independent experiments (more than 50 cells were counted in each condition). *p<0.05, **p<0.01 (Student’s t-test M1 versus mCherry).
Fig 5
Fig 5. Endogenous spastin-M1 is detected in purified LDs.
(A) Endogenous spastin in NSC34 cells was downregulated with siRNA oligonucleotides targeting either all spastin isoforms (Spast), or exon-4 containing isoforms (Ex4). Hereby identified isoforms are indicated. C, control siRNA. (B) NSC34 cells were treated with OA overnight. LDs were purified by sucrose gradient centrifugation and fractions from top (LD) to bottom (2–11) were analyzed by immunoblotting. The whole LD fraction and 1/5 of other fractions were loaded on the gel. PLIN2 was used as marker for LD, and BiP for the ER. LD, lipid droplet fraction; I, input; P, pellet. (C) The relative amount of spastin-M1 to spastin-M87 in the input (I) or in the LD fraction has been quantified using ImageJ. Results shown are the means ± SEM of three independent experiments. (D) HeLa cells co-expressing mCherry-spastin-M87 (red) and Flag-spastin-M1 (blue) were incubated with OA. LDs were stained with BODIPY 493/503 (green). Spastin-M1 recruits spastin-M87 to LDs. Enlargements of boxed areas are shown. Images are individual Z-stacks. Scale bar, 10 μm.
Fig 6
Fig 6. Dspastin dosage affects LD number and size in fat bodies and TAG levels in the larvae.
(A) Fat bodies of larvae expressing DspastinRNAi, DspastinK467R and Dspastin using actin-Gal4 were stained with BODIPY 493/503 to visualize LDs. Control genotype (actin-Gal4/+). Downregulation of Dspastin and expression of K467R mutation cause a decrease of LDs and TAG content, whereas overexpression of Dspastin produces fewer and bigger LDs causing an increase of larval TAG content. Scale bar, 50 μm. (B-D) Quantification of LDs number (B), LD total area (C) and LDs size distribution (D) of genotypes shown in A. (E) Biochemical determination of TAG level from third instar larvae. Significance was calculated using unpaired t-test (two-tailed) in B, C and E and Mann-Whitney test in D. Differences were considered statistically significant at p<0.05 (*) and p<0.005 (**).
Fig 7
Fig 7. Dspastin dosage affects LD number and size in skeletal muscle and nerves.
(A) Representative images of Drosophila larvae muscles labeled with acetylated α-tubulin and BODIPY 493/503. DspastinK467R expression and loss of Dspastin in muscle cells using the Mef2-Gal4 promoter reduced drastically LDs within the tissue. Muscle specific overexpression of Dspastin (Dspastin/Mef2-Gal4) caused increased LD number and size. Control genotype (Mef2-Gal4/+). Scale bar, 10 μm. Quantification of LD number (B) and size distribution (C) in muscles. Significance was calculated using unpaired t-test (two tailed) in B and Mann-Whitney test in C. Differences were considered statistically significant at p<0.05 (*) and p<0.005 (**). (D) Drosophila larval muscle expressing myc-tagged DspastinK467R was labeled with an anti-myc antibody and LDs with BODIPY 493/503. White arrows show LD localization of DspastinK467R. Scale bar, 5 μm. (E) Maximum intensity projections of proximal ventral ganglion nerves from Drosophila third instar larvae expressing Dspastin, DspastinK467R, DspastinRNAi under the neuronal driver Elav-Gal4 and controls (Elav-Gal4/+). Nerves were labeled with acetylated α-tubulin to visualize stable MTs and BODIPY 493/503 to detect LDs. Nerves overexpressing wild-type Dspastin show increased LD size and number, whereas Dspastin downregulation (DspastinRNAi/Elav-Gal4) and DspastinK467R expression (DspastinK467R/Elav-Gal4) resulted in a loss of LDs. Scale bar, 10 μm. Quantification of LD number (F) and size distribution (G) in nerves. Significance was calculated using unpaired t-test (two tailed) in F and Mann-Whitney test in G.
Fig 8
Fig 8. spas-1 knockdown or deletion reduces neutral lipids in C. elegans.
(A) spas-1 was efficiently downregulated. mRNA level of spas-1 from three independent biological replicates was determined using two different RNAi oligonucleotides pairs. (B) Representative images (worms with signal intensity matching the median value) of control and spas-1 downregulated (upper panel) and wild-type and spas-1 (tm683) mutant (lower panel) animals stained with oil red O and imaged by DIC. (C and E) Oil red O staining is reduced upon treatment with spas-1 RNAi or in spas-1 (tm683) mutant animals. These quantitative measurements were performed on three independent biological replicates (each measured in duplicate for RNAi and in triplicate for wild-type and mutant; control RNAi = 178, spas-1 RNAi = 256, wild-type = 227, tm683 = 205 animals). The experiment was repeated, showing comparable results. (D and F) Biochemical quantification of TAG levels. Results shown are means ±SEM for three (D) or six (F) independent biological replicates. Data are normalized to the respective control. TAG determination was repeated for each condition, with similar results. (G) Wild-type or spas-1 (tm683) mutant animals crossed into hjSi56 background (stably expressing the LD marker GFP::DGAT-2) were imaged on day 1 of adulthood and the number of green fluorescent vesicles in the proximal intestinal cell was determined (wild-type = 74, tm683 = 72 animals). *p<0.05, **p<0.01, ****p<0.0001 (unpaired Student’s t-test).

Similar articles

Cited by

References

    1. Fujimoto T, Parton RG. Not just fat: the structure and function of the lipid droplet. Cold Spring Harb Perspect Biol. 2011;3(3): a004838 10.1101/cshperspect.a004838 - DOI - PMC - PubMed
    1. Walther TC, Farese RV Jr. Lipid droplets and cellular lipid metabolism. Annu Rev Biochem. 2012;81:687–714. 10.1146/annurev-biochem-061009-102430 - DOI - PMC - PubMed
    1. Pol A, Gross SP, Parton RG. Review: biogenesis of the multifunctional lipid droplet: lipids, proteins, and sites. J Cell Biol. 2014;204(5):635–46. 10.1083/jcb.201311051 - DOI - PMC - PubMed
    1. Kassan A, Herms A, Fernandez-Vidal A, Bosch M, Schieber NL, Reddy BJ, et al. Acyl-CoA synthetase 3 promotes lipid droplet biogenesis in ER microdomains. J Cell Biol. 2013;203(6):985–1001. 10.1083/jcb.201305142 - DOI - PMC - PubMed
    1. Ghadially FN. Ultrastructural Pathology Of the Cell and Matrix: Butterworths-Heinemann, Boston; 1988.

Publication types

MeSH terms