. 2015 Apr 15;10(4):e0121563.
doi: 10.1371/journal.pone.0121563. eCollection 2015.

Specific cellular incorporation of a pyrene-labelled cholesterol: lipoprotein-mediated delivery toward ordered intracellular membranes

Affiliations

Specific cellular incorporation of a pyrene-labelled cholesterol: lipoprotein-mediated delivery toward ordered intracellular membranes

Gérald Gaibelet et al. PLoS One. .

Abstract

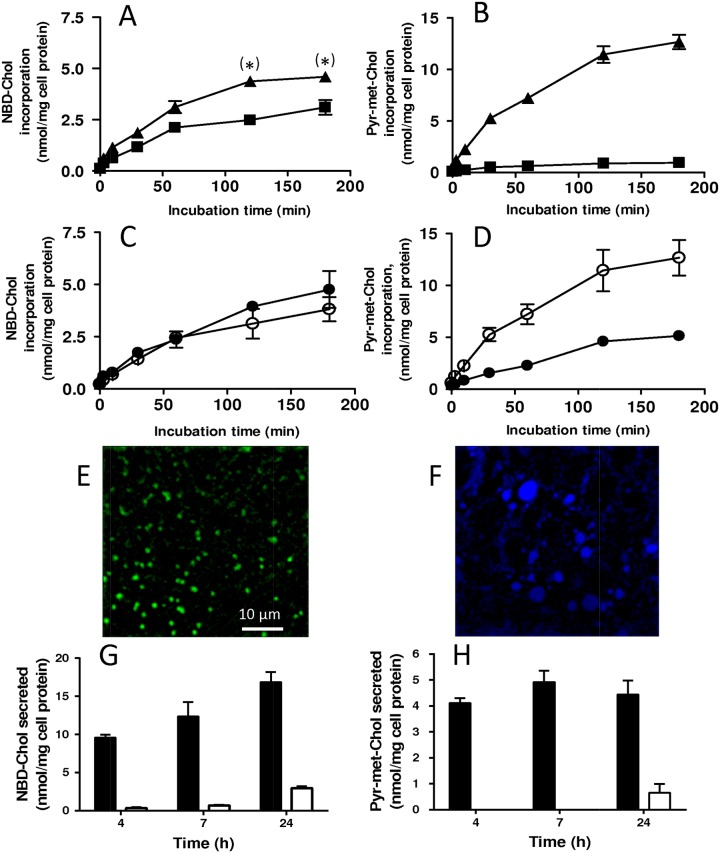
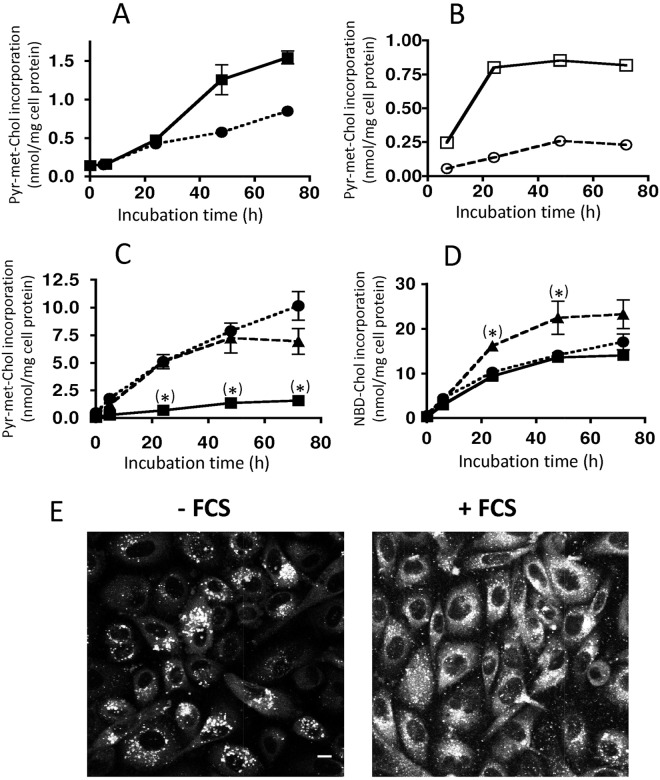
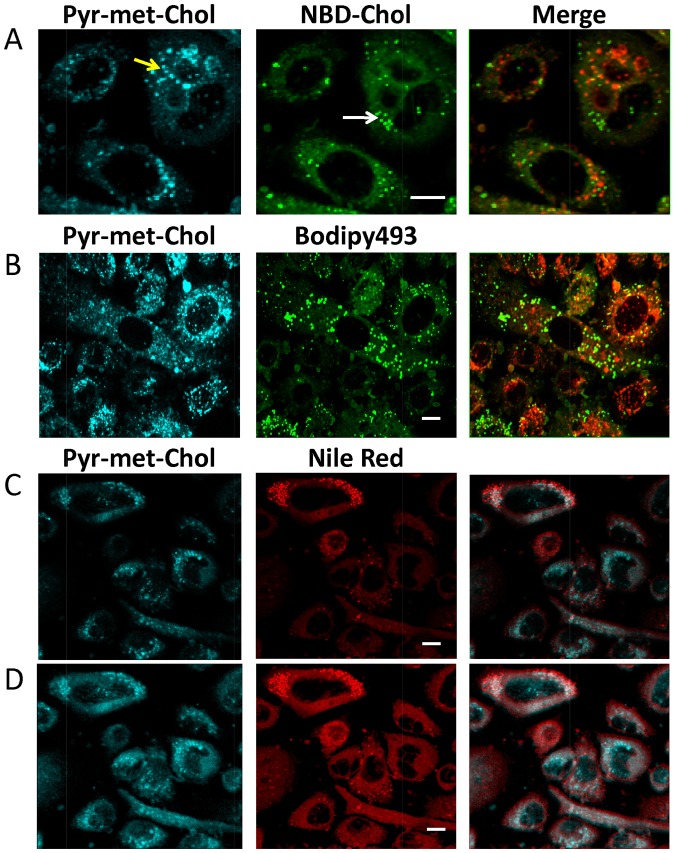
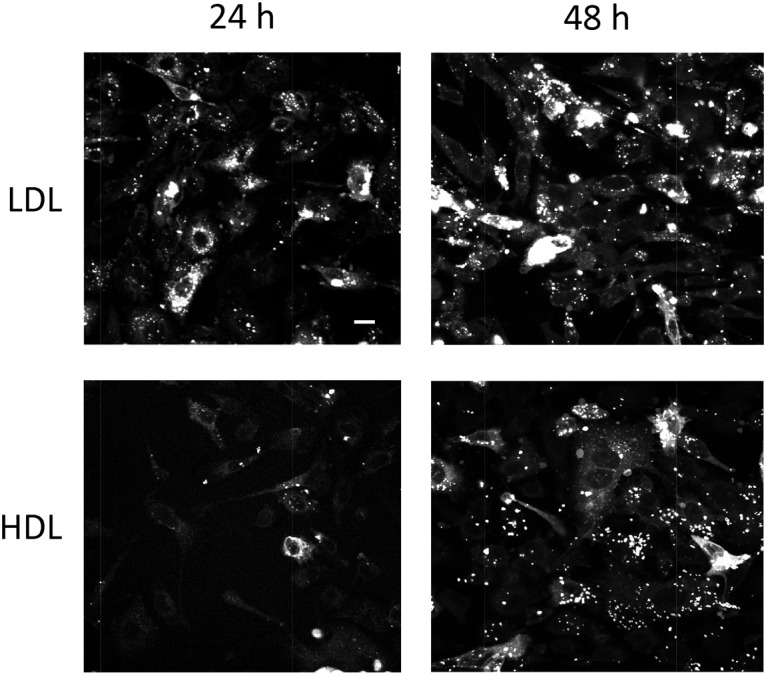
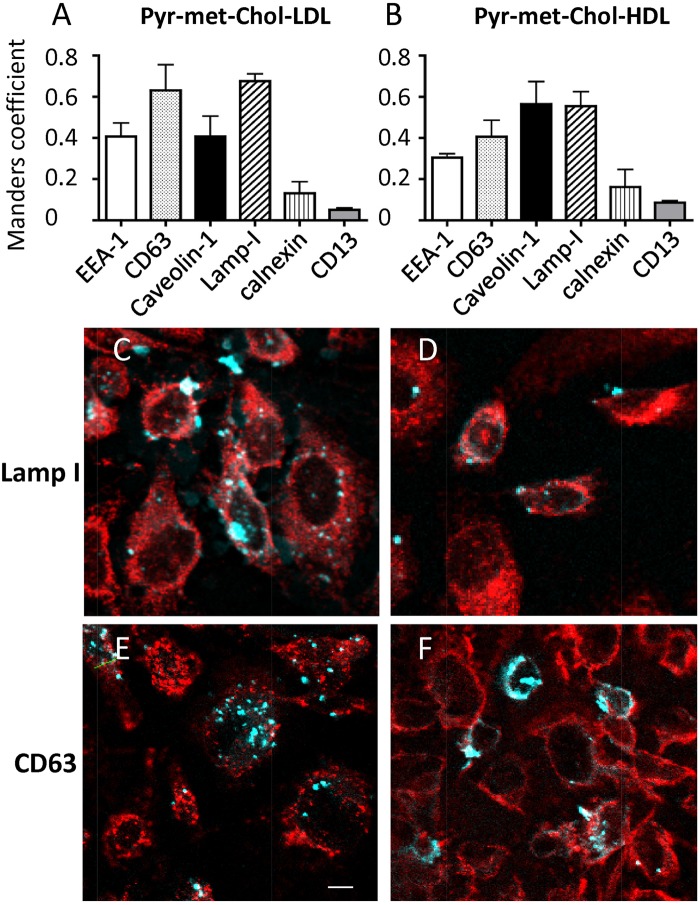
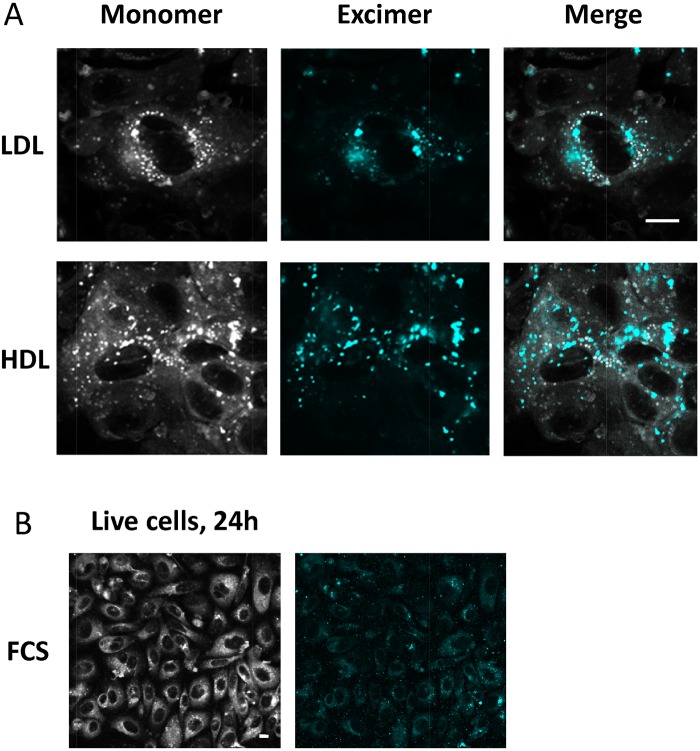
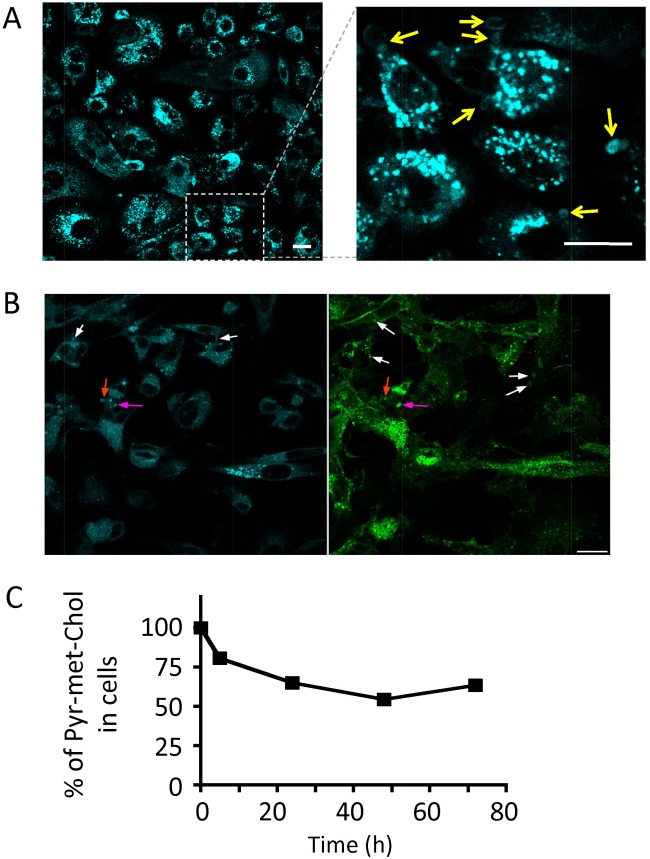
In the aim of testing tools for tracing cell trafficking of exogenous cholesterol, two fluorescent derivatives of cholesterol, 22-nitrobenzoxadiazole-cholesterol (NBD-Chol) and 21-methylpyrenyl-cholesterol (Pyr-met-Chol), with distinctive chemico-physical characteristics, have been compared for their cell incorporation properties, using two cell models differently handling cholesterol, with two incorporation routes. In the Caco-2 cell model, the cholesterol probes were delivered in bile salt micelles, as a model of intestinal absorption. The two probes displayed contrasting behaviors for cell uptake characteristics, cell staining, and efflux kinetics. In particular, Pyr-met-Chol cell incorporation involved SR-BI, while that of NBD-Chol appeared purely passive. In the PC-3 cell model, which overexpresses lipoprotein receptors, the cholesterol probes were delivered via the serum components, as a model of systemic delivery. We showed that Pyr-met-Chol-labelled purified LDL or HDL were able to specifically deliver Pyr-met-Chol to the PC-3 cells, while NBD-Chol incorporation was independent of lipoproteins. Observations by fluorescence microscopy evidenced that, while NBD-Chol readily stained the cytosolic lipid droplets, Pyr-met-Chol labelling led to the intense staining of intracellular structures of membranous nature, in agreement with the absence of detectable esterification of Pyr-met-Chol. A 48 h incubation of PC-3 cells with either Pyr-met-Chol-labelled LDL or HDL gave same staining patterns, mainly colocalizing with Lamp1, caveolin-1 and CD63. These data indicated convergent trafficking downwards their respective receptors, LDL-R and SR-BI, toward the cholesterol-rich internal membrane compartments, late endosomes and multivesicular bodies. Interestingly, Pyr-met-Chol staining of these structures exhibited a high excimer fluorescence emission, revealing their ordered membrane environment, and indicating that Pyr-met-Chol behaves as a fair cholesterol tracer regarding its preferential incorporation into cholesterol-rich domains. We conclude that, while NBD-Chol is a valuable marker of cholesterol esterification, Pyr-met-Chol is a reliable new lipoprotein fluorescent marker which allows to probe specific intracellular trafficking of cholesterol-rich membranes.


Conflict of interest statement

Competing Interests: The authors have declared that no competing interests exist.

Figures

Fig 1
Fig 1. Compared cellular incorporations and effluxes of NBD-Chol and Pyr-met-Chol in Caco-2 cells.
Panels A and B: Influence of the concentration of the solubilizing bile salt taurocholate on cellular incorporation. Differentiated Caco-2 cells cultured on solid support were incubated for various periods with a solution composed of 2 (squares) or 5 mM (triangles) taurocholate, 0.6 mM oleic acid, 0.3 mM 1-monooleoylglycerol, 0.04 mM phosphatidylcholine, 0.16 mM lyso-phosphatidylcholine, and 5 μM of NBD-Chol (panel A) or Pyr-met-Chol (panel B). Cellular contents of NBD-Chol and Pyr-met-Chol were quantified by fluorometry on cells lysed in the presence of 0.5% SDS. When non-apparent, error bars are included within the symbols; p<5% (*) indicates a statistically significant difference between the absence and presence of taurocholate in Panel A; in Panel B, the difference is highly significant between the whole kinetic curves. Panels C and D: Influence of the SR-BI inhibitor BLT-1 on cellular incorporation. Differentiated Caco-2 cells cultured on solid support were incubated for various periods with the same solution than in Panels A and B, containing 5 mM taurocholate with 5 μM of Pyr-met-Chol or NBD-Chol, in the absence (hollow circles) or presence (closed circles) of 10 μM BLT-1. Cellular contents of NBD-Chol and Pyr-met-Chol were quantified by fluorometry on cells lysed in the presence of 0.5% SDS. When non-apparent, error bars are included within the symbols; in Panel D, the difference is highly significant between the whole kinetic curves. Panels E and F: Cell staining. Differentiated Caco-2 cells cultured on porous support were incubated for 2 hours with the same micellar solution than in Panels A and B, containing 5 mM taurocholate with 5 μM of Pyr-met-Chol or NBD-Chol, added in the apical compartment, then fixed and observed by TPE fluorescence microscopy; NBD channel is green (panel E) and pyrene channel is in blue (panel F). Scale bar corresponds to 10 μm. Panels G and H: Compared cells incorporation and efflux kinetics. Differentiated Caco-2 cells cultured on porous support were incubated for various periods with the same solution than in Panels A and B, containing 2 mM taurocholate with 5 μM of Pyr-met-Chol or NBD-Chol, added in the apical compartment. Cellular (dark bars) and basal compartment (white bars) contents of NBD-Chol (panel G) and Pyr-met-Chol (panel H, note the different ordonate scale) were quantified by fluorometry on cells lysed in the presence of 0.5% SDS.
Fig 2
Fig 2. Donor-dependence of the incorporation kinetics of Pyr-met-Chol and NBD-Chol in PC-3 cells.
Panels A and B: PC-3 cells were incubated for various periods with 5 μM Pyr-met-Chol in Ham F12 medium supplemented with 10% fetal calf serum (closed squares) or 10% of human serum (closed circles), or with 0.1 mg/ml of Pyr-met-Chol-labelled purified LDL (open squares) or Pyr-met-Chol-labelled purified HDL (open circles). In Panel B, the difference is highly significant between the whole kinetic curves. Panels C and D: PC-3 cells were incubated for various periods with 5 μM Pyr-met-Chol (panel C) or NBD-Chol (panel D) in Ham F12 medium in the absence (triangles) or in the presence of 10% fetal calf serum (squares) or 1 mg/ml human recombinant albumin (circles). Pyr-met-Chol and NBD-Chol contents were measured by fluorometry on cells lysed in the presence of 0.5% SDS. When non-apparent, error bars are included within the symbols; p<5% (*) indicates a statistically significant difference between the absence and presence of serum (or albumin). Panel E: PC-3 cells were incubated for 24 h with 5 μM Pyr-met-Chol in the absence (left image) or presence (right image) of 10% fetal calf serum, and observed by TPE fluorescence microscopy as living, non-fixed cells. In order to present images with adequate signal intensities giving them a fair legibility, we used a higher acquisition gain for the image recorded in the presence of serum with respect to that in the absence of serum. Scale bar corresponds to 10 μm.
Fig 3
Fig 3. Pyr-met-Chol staining of PC-3 cells.
Panel A: Double staining of PC-3 cells by Pyr-met-Chol (cyan channel) and NBD-Chol (green channel). PC-3 cells were incubated for 48 h in Ham F12 medium supplemented with 10% fetal calf serum in the presence of 5 μM Pyr-met-Chol and 5 μM NBD-Chol; cells were then fixed and observed by TPE fluorescence microscopy. Arrows indicate examples of the intracellular structures intensely stained by either fluorescent cholesterol derivative. The third column is the merge image, channel superimposition is in red. Scale bar corresponds to 10 μm. Panel B: Double staining of PC-3 cells by Pyr-met-Chol (cyan channel) and Bodipy493 (green channel). PC-3 cells were incubated with Pyr-met-Chol as above, then fixed and treated with 1 μg/ml Bodipy493, and observed by TPE microscopy. The third column is the merge image, channel superimposition is in red. Scale bar corresponds to 10 μm. Panels C and D: Double staining of PC-3 cells by Pyr-met-Chol (cyan channel) and Nile Red (red channel). PC-3 cells were incubated with Pyr-met-Chol as above, then fixed and treated with 1 μg/ml Nile Red, and observed by TPE microscopy. The third column is the merge image, channel superimposition is in white. Scale bar corresponds to 10 μm. In panel D, the images were obtained from panel C by increasing the gamma factor to 2, which enhances the low and medium intensity red pixels without modification of the brightest ones, thus allowing for a clear vizualization of the diffuse cytoplasmic staining as well as brighter structures (but no more allowing relative quantifications).
Fig 4
Fig 4. PC-3 cells staining by Pyr-met-Chol-labelled purified HDL or LDL.
TPE microscopy imaging of fixed PC-3 cells was performed after a 24 h (left panels) or 48 h (right panels) incubation in the presence of 0.1 mg/ml of Pyr-met-Chol-labelled purified LDL (upper panels) or Pyr-met-Chol-labelled purified HDL (lower panels). TPE microscopy acquisitions were done with the same gain settings for the 24 h and 48 h incubation conditions, but they were lower for LDL than for HDL. Scale bar corresponds to 10 μm.
Fig 5
Fig 5. Colocalization analysis between Pyr-met-Chol and protein markers of intracellular membrane compartments in PC-3 cells.
TPE microscopy imaging of fixed PC-3 cells was performed after a 48 h incubation with 0.1 mg/ml of Pyr-met-Chol-labelled purified LDL (left panels) or Pyr-met-Chol-labelled purified HDL (right panels), followed by permeabilization with Triton X-100 and immunostaining using specific antibodies against either EEA-1 (early endosomes), CD63 (prostasome-precursor vesicles), caveolin-1 (caveolae), Lamp-1 (late endosomes), calnexin (endoplasmic reticulum) or CD13 (plasma membrane). Panels A and B: Manders coefficient were calculated as indicators of the proportion of Pyr-met-Chol signal in the intensely stained structures that colocalized with the signal of each of the antibodies (secondary antibodies labelled by Cy3, except Alexa-546 for caveolin-1 detection). Panels C and D: Merge images of the colocalization of Pyr-met-Chol (cyan channel) with Lamp-1 (red channel); superimposition is in white. Panels E and F: Merge images of the colocalization of Pyr-met-Chol (cyan channel) with CD63 (red channel); superimposition is in white. Scale bar corresponds to 10 μm.
Fig 6
Fig 6. Simultaneous staining of PC-3 cells by Pyr-met-Chol monomers and excimers.
Panel A: TPE microscopy imaging of fixed PC-3 cells was performed after a 48 h incubation with 0.1 mg/ml of Pyr-met-Chol-labelled purified LDL (upper panels) or Pyr-met-Chol-labelled purified HDL (lower panels), and the fluorescence emission was simultaneously observed for pyrene monomers (white channel) and excimers (cyan channel). Acquisition gains were much higher for images obtained for HDL incubation than for LDL. Scale bar corresponds to 10 μm. Panel B: TPE microscopy imaging of living, non-fixed PC-3 cells was performed after a 24 h incubation of Pyr-met-Chol in the presence of 10% fetal calf serum, and the fluorescence emission was simultaneously observed for pyrene monomers (white channel) and excimers (cyan channel). Scale bar corresponds to 10 μm.
Fig 7
Fig 7. Staining of pericellular membrane structures and Pyr-met-Chol efflux.
Panel A: Pyr-met-Chol staining of pericellular structures. TPE microscopy imaging of fixed PC-3 cells was performed after a 48 h incubation of 5 μM Pyr-met-Chol in the presence of 10% fetal calf serum. Scale bar corresponds to 10 μm. The right image is a magnification of the left one, and the arrows point some of the pericellular structures. Panel B: Fluorescent labelling of transfected PC-3 cells expressing the fusion protein EGFP-SR-BI. TPE microscopy imaging of fixed PC-3/EGFP-SR-BI cells was performed as in panel A (48 h incubation of 5 μM Pyr-met-Chol in the presence of 10% fetal calf serum); cyan channel for Pyr-met-Chol and green channel for EGFP-SR-BI; the white arrows point some of the singly labelled pericellular structures, and the red and pink arrows point two doubly labelled pericellular structures. Panel C: Kinetics of Pyr-met-Chol efflux from PC-3 cells. PC-3 cells were incubated for 48 h with 5 μM Pyr-met-Chol in the presence of 10% fetal calf serum, then washed and further cultured in the absence of Pyr-met-Chol for various periods. Remaining Pyr-met-Chol content was measured by fluorometry on cells lysed in the presence of 0.5% SDS. When non-apparent, error bars are included within the symbols.

References

    1. Simons K, Ikonen E (2000) How cells handle cholesterol. Science 290: 1721–1726. - PubMed
    1. Soccio RE, Breslow JL (2004) Intracellular cholesterol transport. Arterioscler Thromb Vasc Biol 24: 1150–1160. - PubMed
    1. Rothblat GH, Phillips MC (2010) High-density lipoprotein heterogeneity and function in reverse cholesterol transport. Curr Opin Lipidol 21: 229–238. - PMC - PubMed
    1. Hofnagel O, Luechtenborg B, Weissen-Plenz G, Robenek H (2007) Statins and foam cell formation: impact on LDL oxidation and uptake of oxidized lipoproteins via scavenger receptors. Biochim Biophys Acta 1771: 1117–1124. - PubMed
    1. Steinberg D (2009) The LDL modification hypothesis of atherogenesis: an update. J Lipid Res 50 Suppl: S376–381. 10.1194/jlr.R800087-JLR200 - DOI - PMC - PubMed

Publication types