. 2015 Apr 13;10(4):e0123597.
doi: 10.1371/journal.pone.0123597. eCollection 2015.

Metabolic plasticity in resting and thrombin activated platelets

Affiliations

Metabolic plasticity in resting and thrombin activated platelets

Saranya Ravi et al. PLoS One. .

Abstract

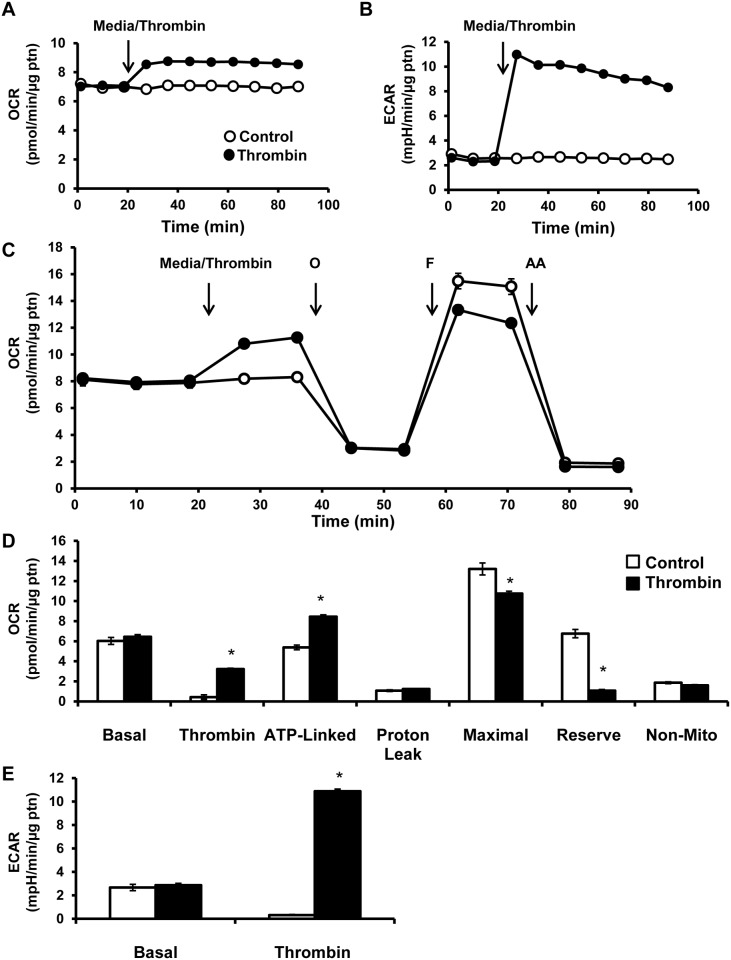
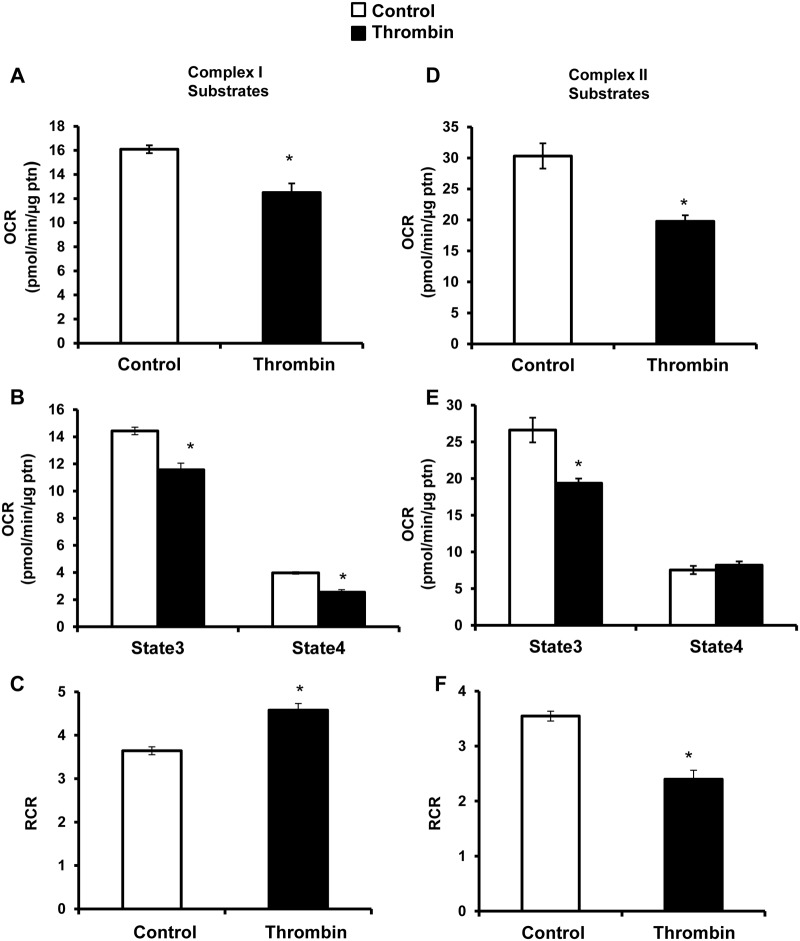
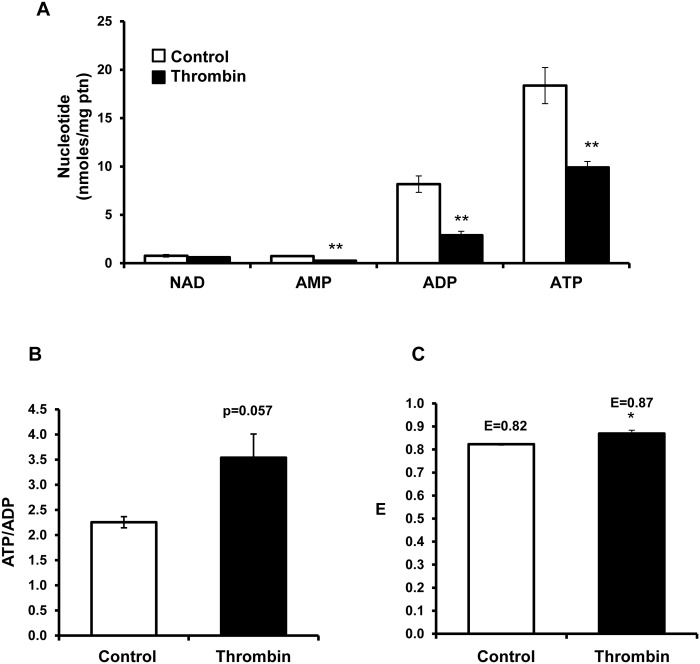
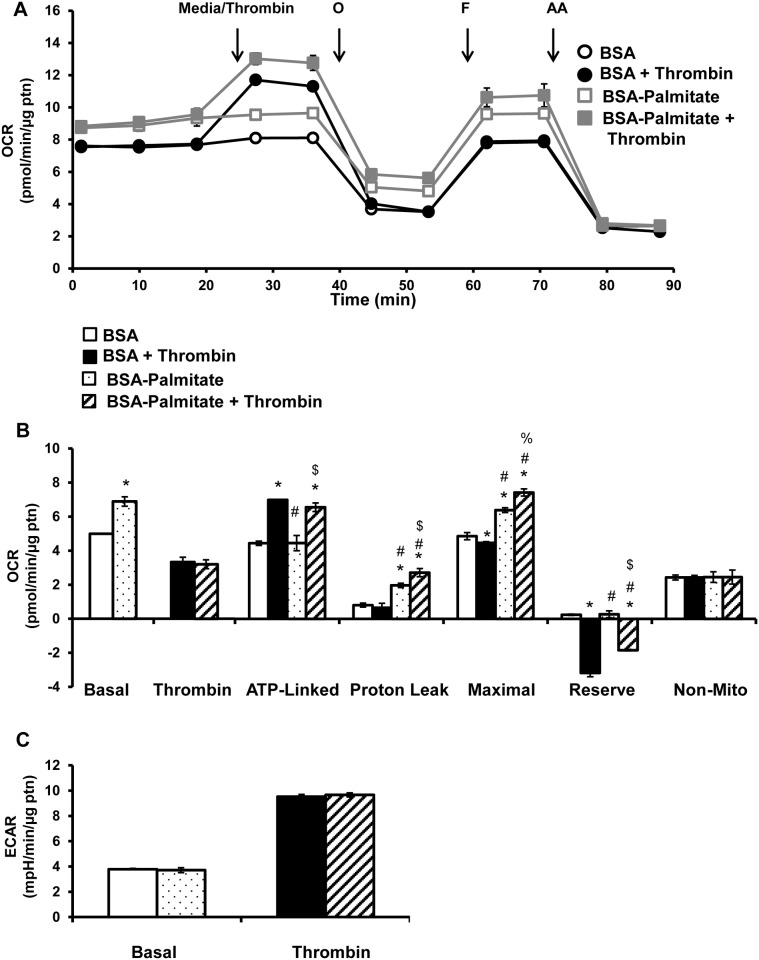
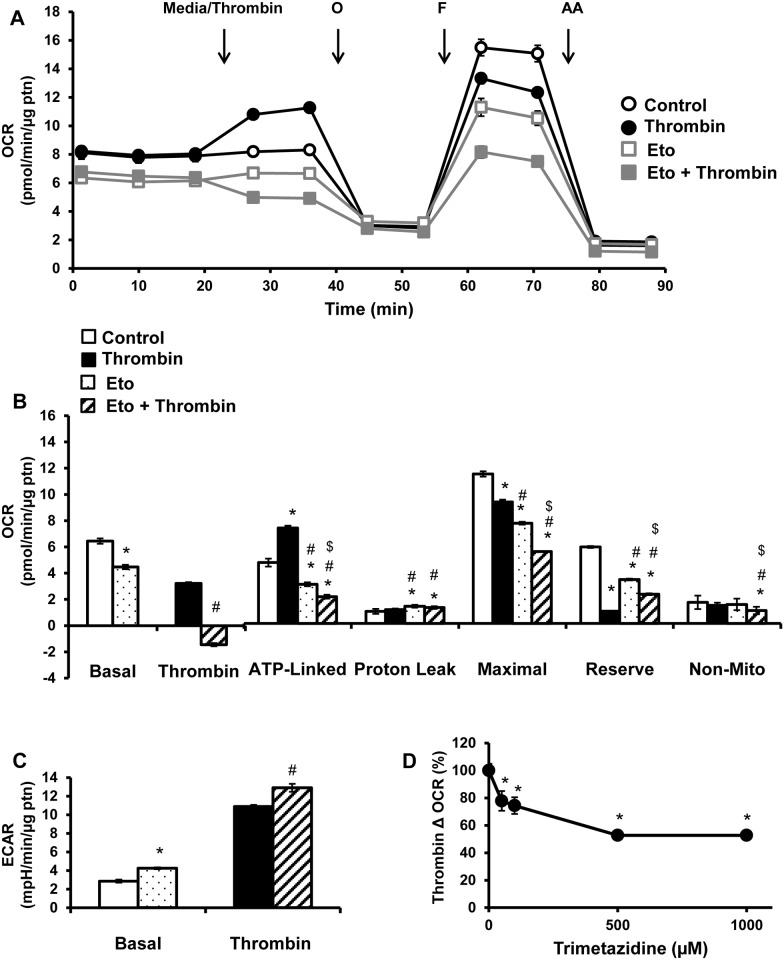
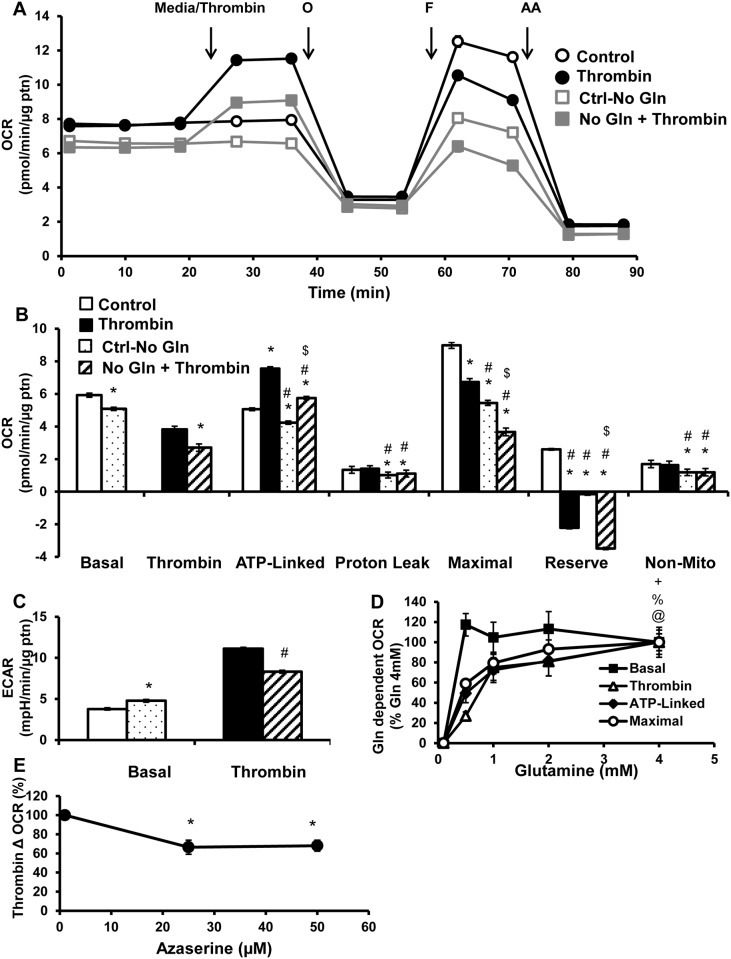
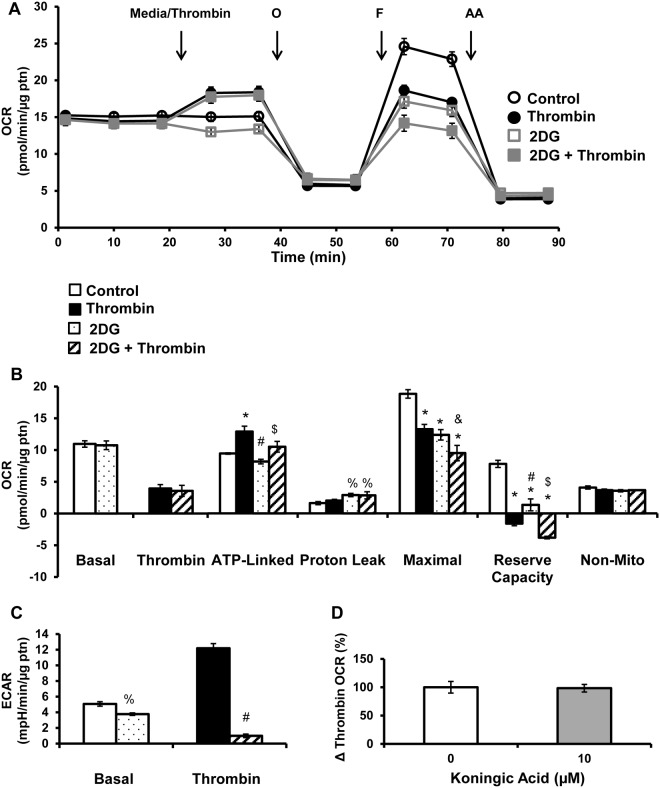
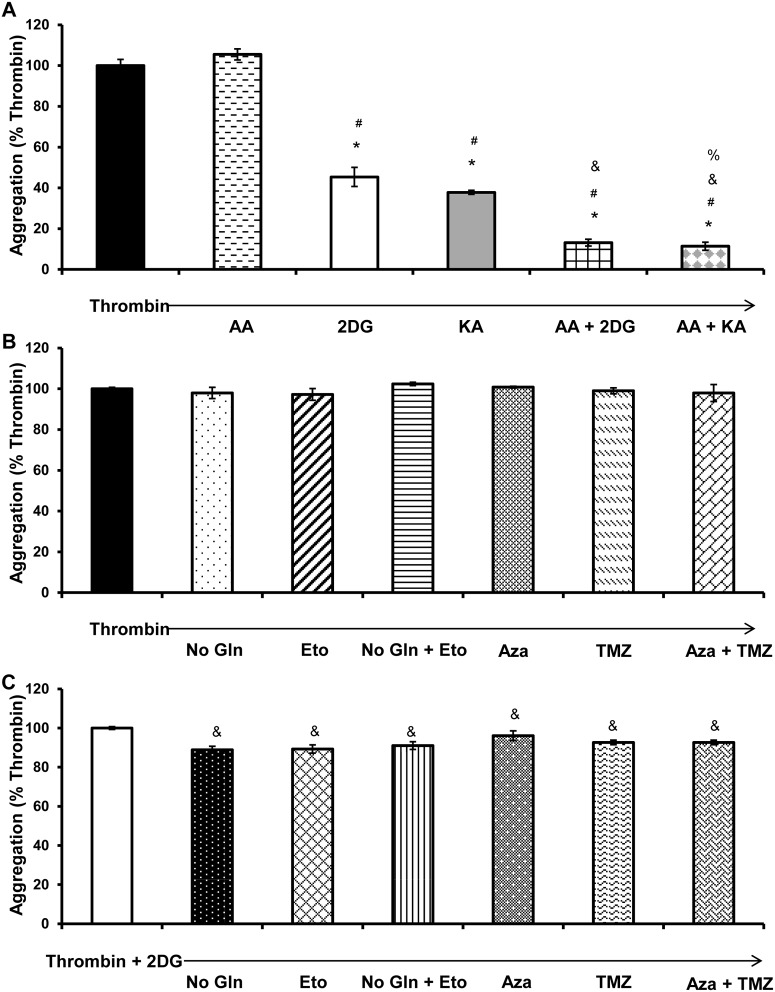
Platelet thrombus formation includes several integrated processes involving aggregation, secretion of granules, release of arachidonic acid and clot retraction, but it is not clear which metabolic fuels are required to support these events. We hypothesized that there is flexibility in the fuels that can be utilized to serve the energetic and metabolic needs for resting and thrombin-dependent platelet aggregation. Using platelets from healthy human donors, we found that there was a rapid thrombin-dependent increase in oxidative phosphorylation which required both glutamine and fatty acids but not glucose. Inhibition of fatty acid oxidation or glutamine utilization could be compensated for by increased glycolytic flux. No evidence for significant mitochondrial dysfunction was found, and ATP/ADP ratios were maintained following the addition of thrombin, indicating the presence of functional and active mitochondrial oxidative phosphorylation during the early stages of aggregation. Interestingly, inhibition of fatty acid oxidation and glutaminolysis alone or in combination is not sufficient to prevent platelet aggregation, due to compensation from glycolysis, whereas inhibitors of glycolysis inhibited aggregation approximately 50%. The combined effects of inhibitors of glycolysis and oxidative phosphorylation were synergistic in the inhibition of platelet aggregation. In summary, both glycolysis and oxidative phosphorylation contribute to platelet metabolism in the resting and activated state, with fatty acid oxidation and to a smaller extent glutaminolysis contributing to the increased energy demand.


Conflict of interest statement

Competing Interests: Please note that Victor Darley-Usmar is a member of the Seahorse Bioscience Scientific Advisory Board. This does not alter the auhtors' adherence to PLOS ONE policies on sharing data and materials.

Figures

Fig 1
Fig 1. Bioenergetic profile of platelets exposed to thrombin.
(A) OCR and (B) ECAR were measured in platelets by establishing a basal rate then injecting thrombin (0.5 U/ml) and following over 64 min. (C) either media or thrombin were injected (0.5 U/ml) and then sequential injections of 1 μg/ml oligomycin (O), 0.6 μM FCCP (F) and 10 μM Antimycin A (AA). (D) Different parameters of mitochondrial function were calculated—basal (basal OCR—AA sensitive OCR), thrombin (thrombin response—basal OCR), ATP-linked (thrombin response—oligomycin sensitive OCR), proton leak (oligomycin sensitive—AA sensitive OCR), maximal (FCCP sensitive—AA sensitive OCR), reserve capacity (FCCP sensitive—thrombin responsive OCR) and non-mitochondrial (AA sensitive OCR). (E) Simultaneously ECAR measured by first establishing a basal rate followed by injection of thrombin (0.5 U/ml). All the bioenergetic measurements were normalized to protein content per well. Data expressed as mean±SEM from one representative donor, n = 3–5 replicates per sample. *p<0.01, different from control.
Fig 2
Fig 2. Mitochondrial assay of platelets exposed to thrombin.
Platelets were plated on XF96 plates in MAS buffer, and first a basal rate of oxygen consumption was measured, followed by injection of thrombin (0.5 U/ml). This was followed by injection of (A) saponin (60 μg/ml), pyruvate (5 mM), malate (2.5 mM) and ADP (1 mM) for complex I substrates (D) or saponin (60 μg/ml), succinate (10 mM) and ADP (1 mM) for complex II substrates. Then oligomycin (1 μg/ml) and antimycin A (10 μM) were injected sequentially. From this different parameters of respiration were calculated—(B, E) state 3 (substrate sensitive—oligomycin sensitive OCR) and state 4 (oligomycin sensitive—AA sensitive OCR). (C, F) Respiratory control ratio (RCR) was calculated using the formulae—state3/state4. Data expressed as mean±SEM from one representative donor, n = 3–5 replicates per sample. *p<0.01, different from control.
Fig 3
Fig 3. Changes in nucleotides after exposure of platelets to thrombin.
Platelets (1 x 10⁸) were plated onto Cell-Tak coated 48 well plates, and exposed to either media or thrombin (0.5 U/ml) for 30 min and the samples were extracted to measure (A) NAD, AMP, ADP and ADP by HPLC. (B) The ATP/ADP ratio and (C) energy charge (ATP + 1/2ADP)/(ATP+ADP+AMP) was calculated. Data expressed as mean±SEM from one representative donor, n = 3 replicates per sample. *p<0.05, **p<0.01, different from control.
Fig 4
Fig 4. Effect of supplementation of BSA-palmitate on thrombin stimulated platelets.
Platelets were plated on Cell-Tak coated XF96 plates, and pre-incubated with either BSA or BSA-palmitate (palmitate 200 μM) for 1h prior to bioenergetic measurements. (A) Basal OCR of platelets were measured prior to injection of thrombin (0.5 U/ml), followed by 1 μg/ml oligomycin (O), 0.6 μM FCCP (F) and 10 μM Antimycin A (AA). (B) Indices of mitochondrial function, basal, thrombin responsive, ATP-linked, proton leak, maximal, reserve capacity and non-mitochondrial OCR were calculated. (C) Basal and thrombin responsive ECAR were calculated from parallel ECAR measurements. Data expressed as mean±SEM from one representative donor, n = 3–5 replicates per sample. *p<0.01, different from control. #p<0.01, different from thrombin. %p<0.05 different from BSA-palmitate, $p<0.01 different from BSA-palmitate.
Fig 5
Fig 5. Effect of inhibiting mitochondrial fatty acid oxidation on thrombin stimulated platelets.
Platelets were plated on Cell-Tak coated XF96 plates, and pre-treated with etomoxir (25 μM) for 1h prior to bioenergetic measurements. (A) Basal OCR of platelets were measured prior to injection of thrombin (0.5 U/ml), followed by 1 μg/ml oligomycin (O), 0.6 μM FCCP (F) and 10 μM antimycin A (AA). (B) Indices of mitochondrial function, basal, thrombin responsive, ATP-linked, proton leak, maximal, reserve capacity and non-mitochondrial OCR were calculated. (C) Basal and thrombin responsive ECAR were calculated from parallel ECAR measurements. Platelets were pre-treated with TMZ (0–1000 μM) for 3h before bioenergetic assay. (D) Change in OCR after thrombin injection presented as a percentage of control. Data expressed as mean±SEM from one representative donor, n = 3–5 replicates per sample. *p<0.01, different from control. #p<0.01, different from thrombin. $p<0.01 different from etomoxir.
Fig 6
Fig 6. Effect of Gln on thrombin stimulated platelets.
Platelets were plated on XF96 plates Cell-Tak coated, and incubated in either regular XF DMEM media or media without Gln for 1h, before bioenergetic measurements. (A) Basal OCR of platelets were measured ahead of thrombin injection (0.5 U/ml), followed by 1 μg/ml oligomycin (O), 0.6 μM FCCP (F) and 10 μM antimycin A (AA). (B) Indices of mitochondrial function, basal, thrombin responsive, ATP-linked, proton leak, maximal, reserve capacity and non-mitochondrial OCR were calculated. (C) Basal and thrombin responsive ECAR were calculated from parallel ECAR measurements. Bioenergetic assays were performed in XF DMEM media containing different concentrations of Gln (0–4 mM). (D) Basal OCR prior to thrombin injection, thrombin linked, ATP linked and maximal OCR after thrombin injection presented as a percentage of highest concentration of Gln (4 mM) after subtraction of no Gln OCR. Platelets were pre-treated with Aza (0–50 μM) for 3h before bioenergetic assay. (E) Change in OCR after thrombin injection presented as a percentage of control. Data expressed as mean±SEM from one representative one donor, n = 3–5 replicates per sample. *p<0.01, different from control. #p<0.01, different from thrombin. $p<0.01 different from Ctrl-no glut. @p<0.01, thrombin linked OCR different from Gln (500 μM). %p<0.01, ATP-linked OCR different from Gln (500 μM). +p<0.01, maximal OCR different from Gln (500 μM).
Fig 7
Fig 7. Effect of inhibiting glycolysis on thrombin stimulated platelets.
Platelets were plated on Cell-Tak coated XF96 plates, and pre-treated with 2DG (120 mM) for 1h before the bioenergetic assay. (A) Basal OCR of platelets were measured prior to thrombin injection (0.5 U/ml), followed by 1 μg/ml oligomycin (O), 0.6 μM FCCP (F) and 10 μM antimycin A (AA). (B) Indices of mitochondrial function, basal, thrombin responsive, ATP-linked, proton leak, maximal, reserve capacity and non-mitochondrial OCR were calculated. (C) Basal and thrombin responsive ECAR were calculated from parallel ECAR measurements. Platelets were pre-treated with koningic acid (10 μM) for 1h prior to the bioenergetic assay. (E) Change in OCR after thrombin injection presented as a percentage of control. Data expressed as mean±SEM from one representative one donor, n = 3–5 replicates per sample. *p<0.01, different from control. %p<0.05, different from control. #p<0.01, different from thrombin. &p<0.05, different from thrombin. $p<0.01 different from 2DG.
Fig 8
Fig 8. Aggregation of platelets stimulated with thrombin in the presence of metabolic inhibitors.
Platelets (40 x 106) in suspension were plated onto 96 well plate reader plates, and change in light transmittance following thrombin (0.5 U/ml) addition was measured in platelets subjected to either 1h or 3h treatments consistent with bioenergetic assays, under the following conditions (A) antimycin A (AA, 10 μM), 2DG (120 mM), koningic acid (KA, 10 μM), AA+2DG together and KA+2DG together (B) presence and absence of Gln in media, etomoxir (25 μM) alone and in combination and TMZ (500 μM) and Aza (25 μM) alone and in combination (C) depletion of Gln, etomoxir, TMZ, and Aza together with 2DG. Extent of aggregation is expressed as a percentage of thrombin 0.5 U/ml. Data expressed as mean±SEM from one representative donor, n = 3 replicates per sample. *p<0.01, different from thrombin. #p<0.01, different from thrombin + AA. $p<0.01, different from thrombin + 2DG.

References

    1. Thon JN, Italiano JE Platelets: production, morphology and ultrastructure. Handb Exp Pharmacol. 2012: 3–22. 10.1007/978-3-642-30726-3_1 - DOI - PubMed
    1. Holmsen H, Kaplan KL, Dangelmaier CA Differential energy requirements for platelet responses. A simultaneous study of aggregation, three secretory processes, arachidonate liberation, phosphatidylinositol breakdown and phosphatidate production. Biochem J. 1982; 208: 9–18. - PMC - PubMed
    1. Misztal T, Przeslaw K, Rusak T, Tomasiak M Peroxynitrite—altered platelet mitochondria—a new link between inflammation and hemostasis. Thromb Res. 2013; 131: e17–25. 10.1016/j.thromres.2012.11.010 - DOI - PubMed
    1. Furie B, Furie BC Mechanisms of thrombus formation. N Engl J Med. 2008; 359: 938–949. 10.1056/NEJMra0801082 - DOI - PubMed
    1. Kramer PA, Ravi S, Chacko B, Johnson MS, Darley-Usmar VM A review of the mitochondrial and glycolytic metabolism in human platelets and leukocytes: Implications for their use as bioenergetic biomarkers. Redox Biology. 2014; 2: 206–210. 10.1016/j.redox.2013.12.026 - DOI - PMC - PubMed

Publication types

LinkOut - more resources