Comparative Study
. 2015 Apr 14;10(4):e0123216.
doi: 10.1371/journal.pone.0123216. eCollection 2015.

Sinonasal microbiome sampling: a comparison of techniques

Affiliations
Comparative Study

Sinonasal microbiome sampling: a comparison of techniques

Ahmed Bassiouni et al. PLoS One. .

Abstract

Background: The role of the sino-nasal microbiome in CRS remains unclear. We hypothesized that the bacteria within mucosal-associated biofilms may be different from the more superficial-lying, free-floating bacteria in the sinuses and that this may impact on the microbiome results obtained. This study investigates whether there is a significant difference in the microbiota of a sinonasal mucosal tissue sample versus a swab sample.

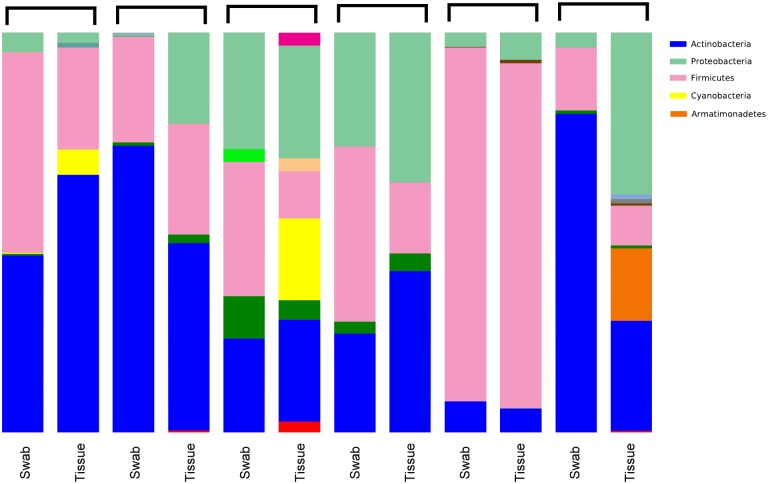
Methods: Cross-sectional study with paired design. Mucosal biopsy and swab samples were obtained intra-operatively from the ethmoid sinuses of 6 patients with CRS. Extracted DNA was sequenced on a Roche-454 sequencer using 16S-rRNA gene targeted primers. Data were analyzed using QIIME 1.8 software package.

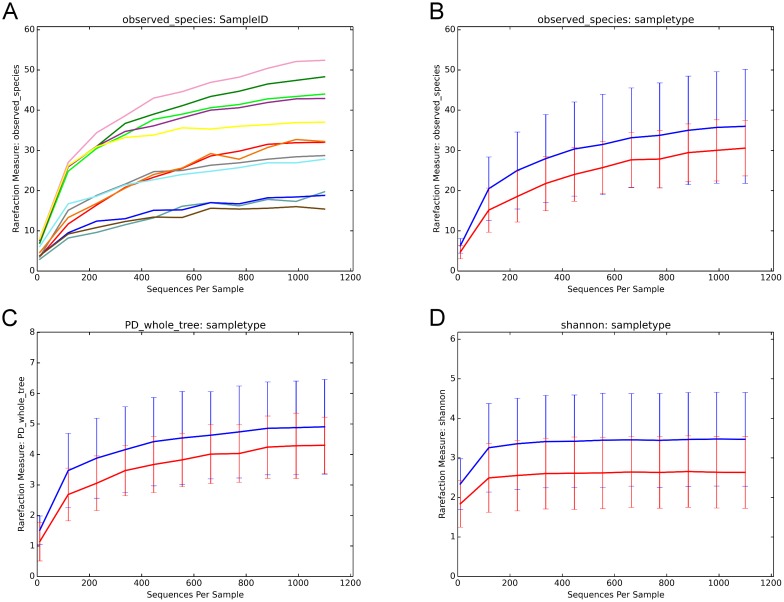
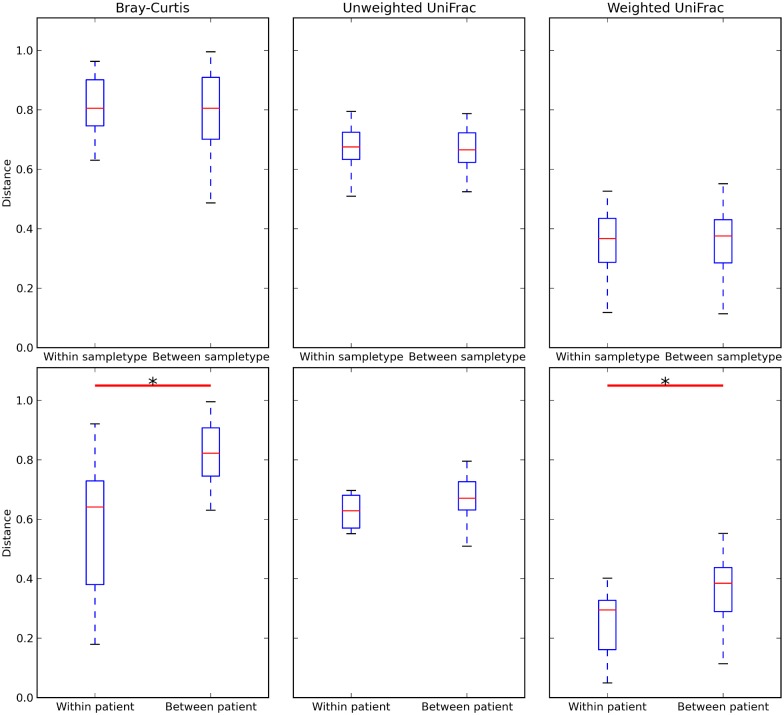
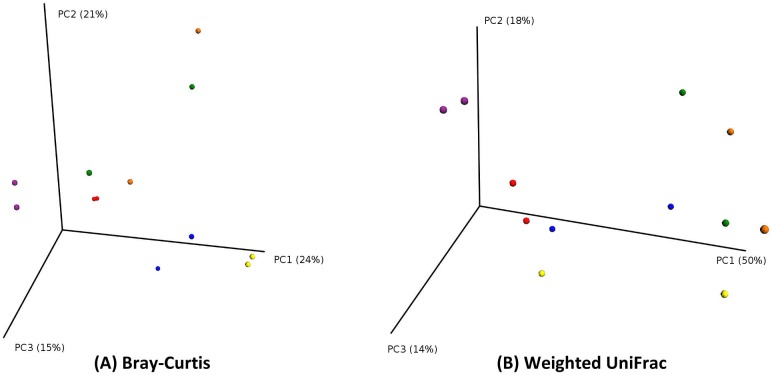
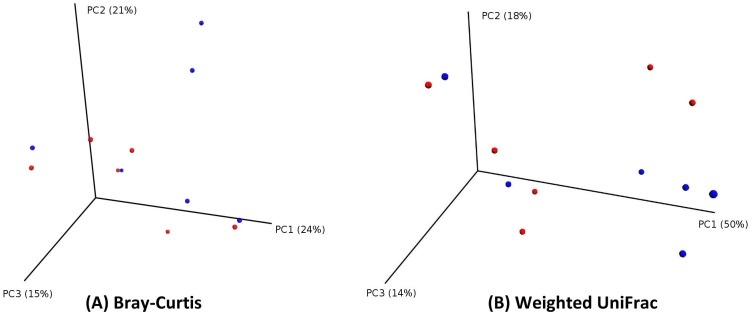
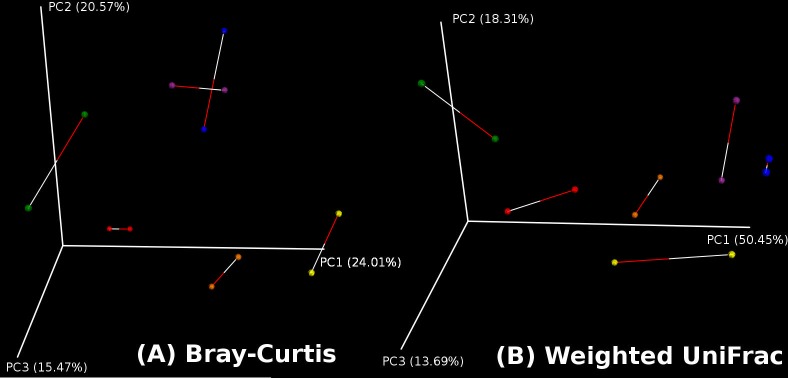
Results: At a maximum subsampling depth of 1,100 reads, the mean observed species richness was 33.3 species (30.6 for swab, versus 36 for mucosa; p > 0.05). There was no significant difference in phylogenetic and non-phylogenetic alpha diversity metrics (Faith's PD_Whole_Tree and Shannon's index) between the two sampling methods (p > 0.05). The type of sample also had no significant effect on phylogenetic and non-phylogenetic beta diversity metrics (Unifrac and Bray-Curtis; p > 0.05).

Conclusion: We observed no significant difference between the microbiota of mucosal tissue and swab samples. This suggests that less invasive swab samples are representative of the sinonasal mucosa microbiome and can be used for future sinonasal microbiome studies.


Conflict of interest statement

Competing Interests: Peter-John Wormald receives royalties from Medtronic ENT for instruments designed and is a consultant for NeilMed. Neither is relevant to this study. There are no other conflicts of interest.

Figures

Fig 1
Fig 1. Distribution of bacterial phyla across all samples.
Fig 2
Fig 2. Rarefaction plots.
(2A) Rarefaction plots of all 12 samples (one curve per sample) showing curves reaching asymptote at the cut-off of 1100 reads. (2B) Rarefaction curves (number of observed species on Y axis) for mucosal tissue (blue curve) versus swab (red curve). Richness at the 1100 cut-off was 36 for mucosal tissue, versus 30.6 for swab. (p > 0.05). (2C) Rarefaction curves (Faith’s Phylogenetic Diversity “PD_Whole_Tree” on Y axis) for mucosal tissue (blue curve) versus swab (red curve). (p > 0.05). (2D) Rarefaction curves (Shannon’s index on Y axis) for mucosal tissue (blue curve) versus swab (red curve).
Fig 3
Fig 3. Boxplots showing distances from Bray-Curtis, unweighted UniFrac, and Weighted UniFrac distance matrices.
Boxplots show no significant difference between within-sampletype and between-sampletype distances, and a statistically significant difference between within-patient and between-patient Bray-Curtis and Weighted UniFrac distances. Whiskers extend to cover the whole range of values. * = p < 0.05 (two-tailed Student's t-test, computed through QIIME’s script make_distance_boxplots.py).
Fig 4
Fig 4. PCoA plots (by patient).
PCoA plot showing good clustering of pairs of samples originating from the same patient. Points in three-dimensional space represent samples, each colored according to the patient. Each patient has two samples. (PCoA of Bray-Curtis distances on the left; PCoA of Weighted UniFrac distances on the right).
Fig 5
Fig 5. PCoA plots (by sample type).
PCoA plots showing less defined clustering of samples, each colored according to the sample type (red for swab; blue for tissue). (PCoA of Bray-Curtis distances on the left; PCoA of Weighted UniFrac distances on the right).
Fig 6
Fig 6. Procrustes plots.
Using the principal coordinates of the PCoA plots, Procrustes transformation on (the first three) principal coordinates of the swab samples over those of the tissue samples was done.

References

    1. Abreu NA, Nagalingam NA, Song Y, Roediger FC, Pletcher SD, Goldberg AN, et al. Sinus microbiome diversity depletion and Corynebacterium tuberculostearicum enrichment mediates rhinosinusitis. Sci Transl Med. 2012;4: 151ra124 10.1126/scitranslmed.3003783 - DOI - PMC - PubMed
    1. Choi E-B, Hong S-W, Kim D-K, Jeon SG, Kim K-R, Cho S-H, et al. Decreased diversity of nasal microbiota and their secreted extracellular vesicles in patients with chronic rhinosinusitis based on a metagenomic analysis. Allergy. 2014;69: 517–526. 10.1111/all.12374 - DOI - PubMed
    1. Feazel LM, Robertson CE, Ramakrishnan VR, Frank DN. Microbiome complexity and Staphylococcus aureus in chronic rhinosinusitis. The Laryngoscope. 2012;122: 467–472. 10.1002/lary.22398 - DOI - PMC - PubMed
    1. Ramakrishnan VR, Feazel LM, Gitomer SA, Ir D, Robertson CE, Frank DN. The Microbiome of the Middle Meatus in Healthy Adults. PLoS ONE. 2013;8: e85507 10.1371/journal.pone.0085507 - DOI - PMC - PubMed
    1. Liu CM, Soldanova K, Nordstrom L, Dwan MG, Moss OL, Contente-Cuomo TL, et al. Medical therapy reduces microbiota diversity and evenness in surgically recalcitrant chronic rhinosinusitis. Int Forum Allergy Rhinol. 2013; 10.1002/alr.21195 - DOI - PMC - PubMed

Publication types

Substances