Review
. 2015 Jun 7;140(11):3696-708.
doi: 10.1039/c4an02065k.

A review of the effects of FSCV and microdialysis measurements on dopamine release in the surrounding tissue

Affiliations
Review

A review of the effects of FSCV and microdialysis measurements on dopamine release in the surrounding tissue

Andrea Jaquins-Gerstl et al. Analyst. .

Abstract

Microdialysis is commonly used in neuroscience to obtain information about the concentration of substances, including neurotransmitters such as dopamine (DA), in the extracellular space (ECS) of the brain. Measuring DA concentrations in the ECS with in vivo microdialysis and/or voltammetry is a mainstay of investigations into both normal and pathological function of central DA systems. Although both techniques are instrumental in understanding brain chemistry each has its shortcomings. The objective of this review is to characterize some of the tissue and DA differences associated with each technique in vivo. Much of this work will focus on immunohistochemical and microelectrode measurements of DA in the tissue next to the microdialysis probe and mitigating the response to the damage caused by probe implantation.


Figures

Fig. 1
Fig. 1
Schematic of “voltammetry next to a microdialysis probe” in the rat brain. (a) A sagittal view of the stimulating electrode (orange) in the medial forebrain bundle, the microelectrode (black) and the microdialysis probe (red) in the striatum (CPu), and the Ag/AgCl reference electrode (blue) in contact with the brain surface. (b) A coronal view showing the microelectrode at a 5° angle from the probe. (c) The tip of the carbon fiber is 70 μm from the probe, and the top of the fiber is 100 μm from the probe. Drugs such as dexamethasone and XJB-5-131 are perfused through the probe. Reproduction reprint permission of Anal. Chem. © 2013.
Fig. 2
Fig. 2
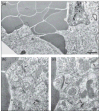
Electron microscopic images of a carbon fiber track in the rat dorsal striatum. (a) At lower magnification, the track appears as an approximately round spot filled with red blood cells (rbc) that apparently fill the void formed when the electrode is explanted. Also visible are a single reactive monocyte (m) and the cell body of a neuron (n). The regions of interest outlined by boxes are shown at higher magnification in (b, c). Blood cells are directly apposed to neuronal structures (arrowheads) or separated from them by a slightly larger space (asterisk in b). The morphological appearance of these neuronal structures is normal. Multiple axon terminals (at) form symmetric (white arrows) or asymmetric synapses (black arrows) onto dendritic shafts or spines, respectively. Scale bar in (a) corresponds to 2 μm for (a) and the scale bar in (c) corresponds to 0.25 μm for (b) and (c). Reproduction reprint permission of J. Neurochem © 2012.
Fig. 3
Fig. 3
Evoked DA responses with a carbon fiber microelectrode (200 μm long) recorded over a range of stimulus intensities ranging from 150 to 450 μA in the striatum of an anesthetized rat. Stimulation was delivered to the ipsilateral MFB at 60 Hz for 0.2s. The solid symbols mark the beginning (square) and ending (triangle) of each stimulus. Reproduction reprint permission of ACS Chem. Neurosci. © 2013.
Fig. 4
Fig. 4
Stimulus responses recorded in the striatum of an anesthetized rat with a voltammetric microelectrode at the posterior site (1 mm away from the probe) (A), 220μm away from the probe (B), and the anterior site (adjacent to the probe) (C). At each site, the solid line (black) is the voltammetric response before probe implantation and the dotted line (red) is the response 2 hrs after probe implantation. The open circles signify the start and end of the electrical stimulation. Reproduction reprint permission of J. Neurosci. Methods © 2005.
Fig. 5
Fig. 5
Stimulus responses recorded in the striatum of an anesthetized rat with a voltammetric microelectrode before and after uptake inhibition. The experiment was initiated at least 2 hrs after probe implantation. Responses were recorded at sites 1 mm away from the probe (A), 220 μm from the probe (B) and adjacent to the probe (C). The responses were recorded before (pre, dotted line-blue) and 20–25 min after (post, solid line-black) systemic nomifensine (20 mg/kg i.p.). The open circles signify the start and end of the electrical stimulation. Reproduction reprint permission of J. Neurosci. Methods © 2005.
Fig. 6
Fig. 6
Left panel: Intrastriatal microinfusion of kynurenate significantly decreases extracellular DA as measured by voltammetry in the striatum (red line) of an anesthetized rat. Microinfusion of kynurenate (kyn) into the parietal cortex had no prolonged effect on the voltammetric signal recorded at a nearby carbon fiber microelectrode (blue line). The horizontal bar labeled kyn indicates when the infusion took place. The lines were obtained by averaging the traces recorded in each of a group of animals (red, n = 26 in 19 animals: blue, n = 3 in 3 animals). The symbols indicate the mean and the standard deviations upon which statistical analyses were based. The infusion had a significant effect in the striatum (one-way ANOVA: f = 43.97, d.f. = 3,103, p < 0.001) but not in the parietal cortex. Right panel: Difference voltammograms obtained in the striatum (red line) and cortex (blue line). These difference voltammograms were obtained by subtracting the voltammograms recorded after the infusions (tw2, left panel) from those recorded before the infusion (tw1, left panel). The difference voltammogram obtained in the striatum exhibits DA oxidation and reduction features whereas that obtained in the cortex does not. Reproduction reprint permission of J. Neurochem. © 2004.
Fig. 7
Fig. 7
Systemic administration of the nomifensine (20 mg/kg i.p.) either abolishes (a) or significantly diminishes (b) the effect of kynurenate on extracellular dopamine in the striatum of an anesthetized rat. (a) In four of eight animals (blue line), nomifensine eliminated the effect of kynurenate (two-way ANOVA; p < 0.001). In these animals, subtracted cyclic voltammograms obtained prior to nomifensine administration (black line) were characteristic of dopamine. Voltammograms obtained after nomifensine administration were not characteristic of dopamine (blue line). (b) In four other animals, systemic administration of nomifensine (green line) significantly diminished the response to kynurenate infusion (two-way ANOVA, p < 0.05). In the right panel; subtracted voltammograms were characteristic of dopamine both before (black line) and after (green line) nomifensine administration. (c) Systemic administration of saline had no affect on the response to kynurenate (two-way ANOVA). Voltammograms obtained before (black line) and after (red line) saline were characteristic of dopamine. The horizontal bars indicate when the infusions took place. Reproduction reprint permission of J. Neurochem. © 2004.
Fig. 8
Fig. 8
Systemic administration of carbi-DOPA (150 mg/kg i.p.) 3 hours after probe implantation in an anesthetized rat. Microdialysis samples were collected from the striatum and concentrations of DA and carbi-Dopa were determined by high pressure liquid chromatography-photoluminescence following electron transfer detection. Administration of carbi-DOPA significantly increases dialysate carbi-DOPA levels (squares) but does not affect dialysate DA levels (circles). In the case of DA, the error bars are smaller than the symbols. Reproduction reprint permission of J. Neurosci. Methods © 2008.
Fig. 9
Fig. 9
Fluorescence microscopy of microdialysis probe in vivo of an anesthetized rat. Non-injured tissue (A) is compared to microdialysis probes tracks after 1 hr (B), 4 hr (C) and 24 hr (D) implants. Green (fluorescent beads) represents blood flow. Red represents blood vessels (anti-PECAM). In healthy tissue the red and green labeling overlay each other. Near the probe tracks the labels do not overlay, showing the presence of vessels (red) with no flow (no green). Moreover the red labeling is diffuse after acute microdialysis (Panel B), showing the release of the contents of endothelial cells into interstitial spaces. Over time, the diffuse labeling fades (Panels C and D), indicating that an active wound-healing process is underway. Scale bar represents 100μm. Reproduction reprint permission of J. Neurosci. Methods © 2009.
Fig. 10
Fig. 10
Effect of in vivo microdialysis probes on striatal glial cells labeled with GFAP antibody of an anesthetized rat. a) A microdialysis probe track at 24 hours b) Enlargement of the area in the yellow box - shows a glial cell extending a process ~300 μm towards the track. Reproduction reprint permission of J. Neurosci. Methods © 2009. c) Striatal tissue next to a microdialysis probe track at 5 days; the edge of the track is on the left side of the image. The right-hand column (panels d, e, and f) show enlargements of the white boxes in panel c. Reproduction reprint permission of Anal. Chem. © 2011. g) GFAP image of a glial barrier formed after 5 days of microdialysis without DXM. h) GFAP image of a probe track after 5 days of retrodialysis of DXM. Reproduction reprint permission of Anal. Chem. © 2011.
Fig. 11
Fig. 11
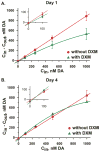
DA concentration difference plots obtained in the rat striatum on day 1 (A) and day 4 (B) of microdialysis with (green) and without (red) DXM. The data points represent the mean ± (standard error). The solid lines show the linear regression of the data obtained without DXM (red) and the non-linear regression of the data obtained with DXM (green). Microdialysis probes (BASi MD-2204) were lowered over 30 minutes through the guide cannula into the striatum. The probes were perfused continuously for 5 days at 0.610 μL/min. Insets expand the region near the origin to visualize Cout,c and Cnnf. Reproduction reprint permission of Anal. Chem. © 2011.
Fig. 12
Fig. 12
Effect of aCSF (a), DXM (b), or XJB (c) on electrically evoked DA responses measured in vivo before implanting the probe (blue lines), 2 h and 40 min after implanting the probe (red lines, the response was non-detectable in a) and 25 min after nomifensine (green lines). The solid lines are the average of the responses in each group of rats (n = 6 per group), and the broken lines are confidence intervals based on the standard error of the mean of each data point. The black diamonds show when the stimulus begins and ends. Reproduction reprint permission of Anal. Chem. © 2013.
Fig. 13
Fig. 13
DXM and XJB mitigate the histochemical impact of penetration injury in the striatum of an anesthetized rat. Separate columns provide representative images of tissue after retrodialysis of aCSF, DXM, and XJB for 4 h. The left-most column shows images of nonimplanted control striatal tissue. Separate rows provide representative images of tissue labeled with markers for blood flow (nanobeads), neuronal nuclei (NeuN), macrophages (ED-1), and DA axons and terminals (TH). The probe track is in the center of the images and marked with an asterisk. Scale bars are 200 μm. Reproduction reprint permission of Anal. Chem. © 2013.

Similar articles

Cited by

References

    1. Abercrombie ED, Zigmond MJ. J Neurosci. 1989;9:4062–4067. - PMC - PubMed
    1. Arbuthnott GW, Fairbrother IS, Butcher SP. J Neurosci Methods. 1990;34:73–81. - PubMed
    1. Bosche B, Dohmen C, Graf R, Neveling M, Staub F, Kracht L, Sobesky J, Lehnhardt FG, Heiss WD. Stroke. 2003;34:2908–2913. - PubMed
    1. Di Chiara G. J Psychopharmacol. 1998;12:54–67. - PubMed
    1. Kehr J. In: Handbook of Behavioral Neuroscience. Ben HCW, Thomas IFHC, editors. Vol. 16. Elsevier; 2006. pp. 111–129.

Publication types

LinkOut - more resources