. 2015 Jun;26(6):853-61.
doi: 10.1007/s13361-015-1136-8. Epub 2015 Apr 16.

Large-scale mass spectrometry imaging investigation of consequences of cortical spreading depression in a transgenic mouse model of migraine

Affiliations

Large-scale mass spectrometry imaging investigation of consequences of cortical spreading depression in a transgenic mouse model of migraine

Ricardo J Carreira et al. J Am Soc Mass Spectrom. 2015 Jun.

Abstract

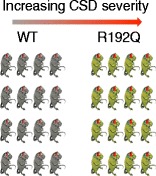
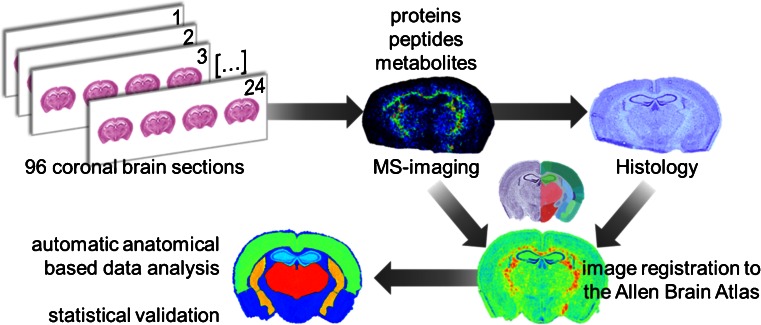
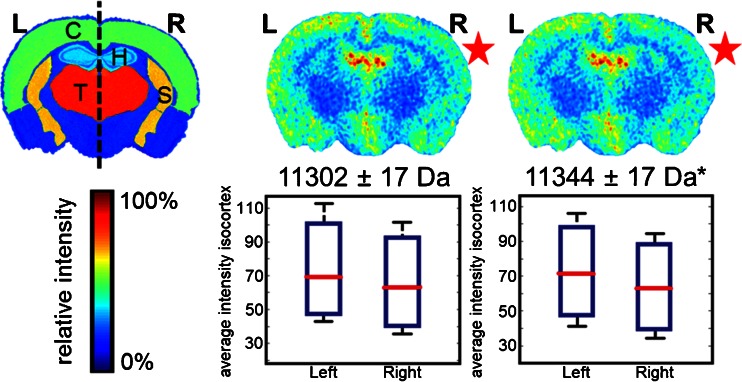
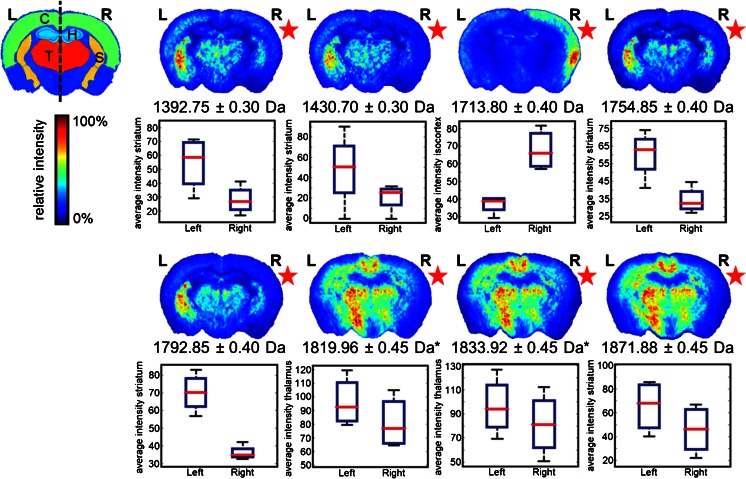
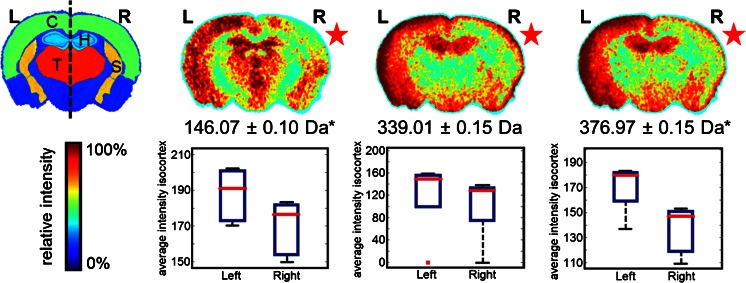
Cortical spreading depression (CSD) is the electrophysiological correlate of migraine aura. Transgenic mice carrying the R192Q missense mutation in the Cacna1a gene, which in patients causes familial hemiplegic migraine type 1 (FHM1), exhibit increased propensity to CSD. Herein, mass spectrometry imaging (MSI) was applied for the first time to an animal cohort of transgenic and wild type mice to study the biomolecular changes following CSD in the brain. Ninety-six coronal brain sections from 32 mice were analyzed by MALDI-MSI. All MSI datasets were registered to the Allen Brain Atlas reference atlas of the mouse brain so that the molecular signatures of distinct brain regions could be compared. A number of metabolites and peptides showed substantial changes in the brain associated with CSD. Among those, different mass spectral features showed significant (t-test, P < 0.05) changes in the cortex, 146 and 377 Da, and in the thalamus, 1820 and 1834 Da, of the CSD-affected hemisphere of FHM1 R192Q mice. Our findings reveal CSD- and genotype-specific molecular changes in the brain of FHM1 transgenic mice that may further our understanding about the role of CSD in migraine pathophysiology. The results also demonstrate the utility of aligning MSI datasets to a common reference atlas for large-scale MSI investigations.


Figures

Graphical Abstract
Graphical Abstract
Figure 1
Figure 1
Schematic of workflow developed to analyze the effect of CSD in WT and R192Q mouse brains. Ninety-six coronal brain sections were obtained from a total of 32 mouse brains (three consecutive sections per animal). Proteins, peptides, and metabolites were independently analyzed by MSI using optimized sample treatment for each molecular class as described in the Materials and Methods section. Each section was stained with Nissl reagent after matrix removal and the MSI datasets, and histologic images were aligned to the Allen Brain Atlas of mouse brain [19]. Automatic anatomical annotation of regions of interest allowed the extraction of MSI data from specific brain regions of interest and statistical analysis
Figure 2
Figure 2
Protein MSI dataset: differences between CSD (right, R) and control hemisphere (left, L) in R192Q-CSD mouse brain. Each image corresponds to the visualization of the average distribution of a particular m/z feature in five mouse brains after alignment to the ABA (*P < 0.05, Student’s t-test). C = cortex; T = thalamus; H = hippocampus; S = Striatum
Figure 3
Figure 3
Peptide MSI dataset: differences between CSD (right, R) and control hemisphere (left, L) in R192Q-CSD mouse brain. Each image corresponds to the visualization of the average distribution of a particular m/z feature in five mouse brains after alignment to the ABA (*P < 0.05, Student’s t-test). C = cortex; T = thalamus; H = hippocampus; S = striatum
Figure 4
Figure 4
Metabolite MSI dataset: differences between CSD (right, R) and control hemisphere (left, L) in R192Q-CSD mouse brain. Each image corresponds to the visualization of the average distribution of a particular m/z feature in five mouse brains after alignment to the ABA (*P < 0.05, Student’s t-test). C = cortex; T = thalamus; H = hippocampus; S = striatum

References

    1. Caprioli RM, Farmer TB, Gile J. Molecular imaging of biological samples: localization of peptides and proteins using MALDI-TOF MS. Anal. Chem. 1997;69:4751–4760. doi: 10.1021/ac970888i. - DOI - PubMed
    1. McDonnell LA, Heeren RM, Andrén PE, Stoeckli M, Corthals GL. Going forward: increasing the accessibility of imaging mass spectrometry. J. Proteome. 2012;75:5113–5121. doi: 10.1016/j.jprot.2012.05.016. - DOI - PubMed
    1. Norris JL, Caprioli RM. Analysis of tissue specimens by matrix-assisted laser desorption/ionization imaging mass spectrometry in biological and clinical research. Chem. Rev. 2013;113:2309–2342. doi: 10.1021/cr3004295. - DOI - PMC - PubMed
    1. McDonnell LA, Heeren RMA. Imaging mass spectrometry. Mass Spectrom. Rev. 2007;26:606–643. doi: 10.1002/mas.20124. - DOI - PubMed
    1. McDonnell LA, Corthals GL, Willems SM, van Remoortere A, van Zeijl RJ, Deelder AM. Peptide and protein imaging mass spectrometry in cancer research. J. Proteome. 2010;73:1921–1944. doi: 10.1016/j.jprot.2010.05.007. - DOI - PubMed

Publication types

MeSH terms

Substances

Supplementary concepts