. 2015 Apr 15;7(283):283ra51.
doi: 10.1126/scitranslmed.aaa4442.

PI3K inhibition results in enhanced estrogen receptor function and dependence in hormone receptor-positive breast cancer

Affiliations

PI3K inhibition results in enhanced estrogen receptor function and dependence in hormone receptor-positive breast cancer

Ana Bosch et al. Sci Transl Med. .

Abstract

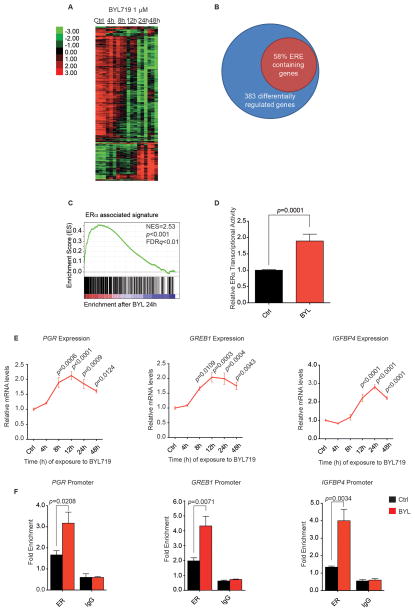
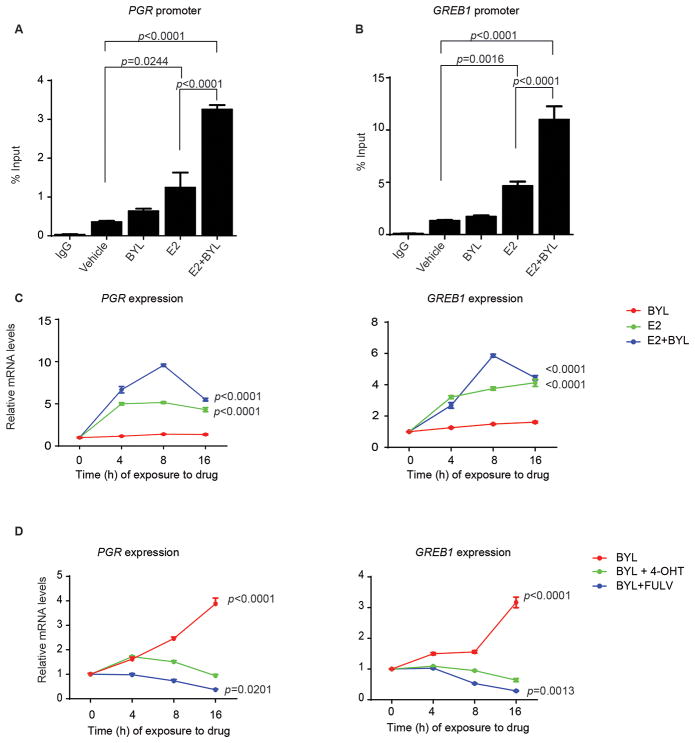
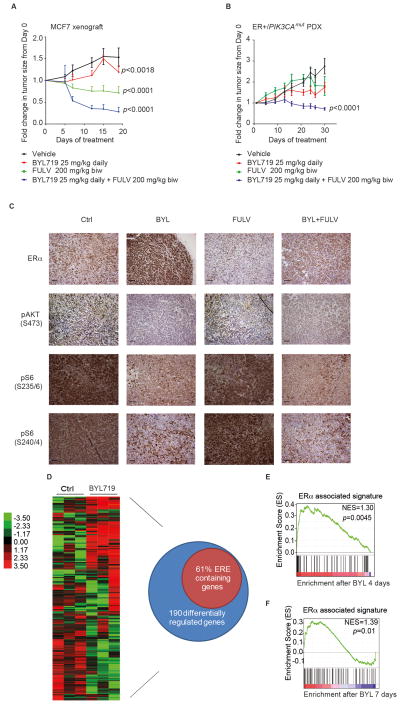
Activating mutations of PIK3CA are the most frequent genomic alterations in estrogen receptor (ER)-positive breast tumors, and selective phosphatidylinositol 3-kinase α (PI3Kα) inhibitors are in clinical development. The activity of these agents, however, is not homogeneous, and only a fraction of patients bearing PIK3CA-mutant ER-positive tumors benefit from single-agent administration. Searching for mechanisms of resistance, we observed that suppression of PI3K signaling results in induction of ER-dependent transcriptional activity, as demonstrated by changes in expression of genes containing ER-binding sites and increased occupancy by the ER of promoter regions of up-regulated genes. Furthermore, expression of ESR1 mRNA and ER protein were also increased upon PI3K inhibition. These changes in gene expression were confirmed in vivo in xenografts and patient-derived models and in tumors from patients undergoing treatment with the PI3Kα inhibitor BYL719. The observed effects on transcription were enhanced by the addition of estradiol and suppressed by the anti-ER therapies fulvestrant and tamoxifen. Fulvestrant markedly sensitized ER-positive tumors to PI3Kα inhibition, resulting in major tumor regressions in vivo. We propose that increased ER transcriptional activity may be a reactive mechanism that limits the activity of PI3K inhibitors and that combined PI3K and ER inhibition is a rational approach to target these tumors.


Conflict of interest statement

Competing interests: J.B. and N.R. have consulted for Novartis Pharmaceuticals. J.B. is a past member of the scientific advisory board of Seragon. N.R. serves on advisory boards for AstraZeneca and Millennium. J.C. serves as an advisor for Roche/Genentech and has received speaking fees from Novartis and Roche. A.P. has served in an advisory role for Nanostring Technologies, Inc. J.R. serves on advisory boards for Novartis, Lilly, Leti, Servier, and KPS.

Figures

Figure 1
Figure 1. PI3K inhibition promotes ER function
A) MCF7 cells were treated with BYL719 1 μM over a period of 48 hours. RNA was isolated at specified time points and expression microarray analysis performed. Heat map represents genes whose expression differed significantly across different time points with a FDR ≤ 1%. Each of the columns under the experimental conditions represents one biological replicate. B) PI3Kα inhibition leads to modulation of genes containing ER binding sites (ERE). MCF7 cells were treated with BYL719 1 μM, and gene expression analysis was performed as described in A. The diagram represents the genes that were differentially regulated upon treatment across all the time points (SAM analysis FDR ≤ 1%) and the percentage of these genes that contained an ER-binding element (defined by ER ChIP-sequencing (42)). C) GSEA analysis was performed to determine which gene sets were enriched in our data set (FDR ≤ 25%). Graph represents enrichment for ER-associated signature as described in (43). D) MCF7 cells were transfected with firefly- 3X ERE TATA luc and pRL-TK Renilla plasmids, and treated with vehicle (Ctrl) or BYL719 1 μM for 16 hours. Results represent firefly-luciferase activity measured by luminescence and normalized both to renilla-luciferase luminescence for transfection efficiency and to Ctrl. Two-tailed Student’s unpaired t test was performed to compare Ctrl vs BYL-treated cells. E) MCF7 cells were treated with BYL719 1 μM over a period of 48 hours, and RNA was isolated at the indicated times. qPCR was performed to detect βACTIN, PGR, GREB1, and IGFBP4 gene expression. The data are presented relative to βACTIN and to expression in vehicle-treated cells (Ctrl). One-way ANOVA statistical test was used to compare gene expression between each time point and vehicle-treated cells, applying the Bonferroni method to correct for multiple comparisons. Error bars denote the SEM of at least two biological replicates, each with three technical replicates. F) MCF7 cells were treated with BYL719 1 μM (BYL) or vehicle (Ctrl), and ChIP was performed with anti-ERα antibody or control IgG. Primers to amplify the ER-binding regions of the PGR, GREB1, and IGFBP4 promoters were used in qPCR to determine fold enrichment relative to a noncoding region. Two-tailed Student’s unpaired t test was performed to compare Ctrl vs. BYL-treated cells. Error bars represent the standard error of the mean (SEM) of three independent experiments.
Figure 2
Figure 2. PI3K inhibition induces ER expression
A) MCF7 cells were treated with BYL719 1 μM over a 48 hour period, and RNA was isolated at the indicated times. qPCR was performed to detect βACTIN and ESR1 expression. The data are presented relative to βACTIN and to expression of ESR1 in vehicle-treated control (Ctrl). One-way ANOVA statistical test was used to compare gene expression between each time point and to vehicle-treated cells, applying the Bonferroni method to correct for multiple comparisons. Error bars denote the SEM of at least two biological replicates, each with three technical replicates. B) MCF7 cells were treated with BYL719 1 μM over a period of 48 hours, and total protein was isolated at the indicated times. Immunoblotting was performed to detect expression of ER, phosphorylation of AKT at serine 473 (pAKT S473), and βACTIN. Graph represents the fold change of total ERα with respect to βACTIN and to untreated samples (Ctrl) of two independent experiments. Statistical analysis was done using the one-way ANOVA statistical test with the Bonferroni method to correct for multiple comparisons. C) 16α-18F-fluoro-17β-estradiol (18F-FES) uptake in T47D xenograft mouse models treated with vehicle or BYL719 daily. The uptake was measured after a 4 day treatment, 2 hours after the last dose, and is represented as % injected dose per gram of tumor tissue (%ID/g). Statistical analysis to compare 18F-FES uptake between the Ctrl and the BYL-treated mice was performed by means of a non-parametric Kruskal-Wallis test. D) Graphical representation of ESR1 transcript abundance in twenty paired breast cancer biopsies before (PRE) and on BYL719 treatment (ON) collected as part of two clinical trials with the p110α inhibitor BYL719. ESR1 was one of the 105 breast cancer-specific genes analyzed using the nCounter platform. E) Graphical representation of the induction of a luminal A signature upon BYL719 treatment in the tumor samples used in figure 2D. F) MCF7 cells were treated with vehicle or BYL719 1 μM for 2 hours. ChIP was performed with anti-FOXO3A antibody or control IgG. Primers to amplify the FOXO3A-binding regions of the ESR1 promoter were used in qPCR to determine fold enrichment relative to input. Two-tailed Student’s unpaired t test was performed to compare mean signal amplification between vehicle and BYL719-treated samples. Error bars represent the standard error of the mean (SEM) of two independent experiments with three technical replicates each. G) MCF7 cells were transfected with non-targeted siRNA (Ctrl) or FOXO3 siRNA. Forty-eight hours later, cells were treated with vehicle or BYL719 1 μM for 24 hours. mRNA was isolated, and qPCR was performed to detect βACTIN, FOXO3A, and ESR1 expression. The data are presented relative to βACTIN and to expression in the samples treated with Ctrl siRNA and vehicle. One-way ANOVA statistical test was used to compare gene expression between each condition and Ctrl siRNA and vehicle-treated cells, applying the Bonferroni method to correct for multiple comparisons. Error bars denote the SEM of two independent experiments with three technical replicates each.
Figure 3
Figure 3. PI3K inhibitor-mediated induction of hormone signaling is dependent on E2 and ER
MCF7 cells were treated with BYL719 1 μM, estradiol (E2) 10 nM, or the combination after 48 hours in estrogen-free medium. ChIP was performed with anti-ERα antibody or control IgG. Primers to amplify the ER-binding regions of the PGR (A) and GREB1 (B) promoters were used in qPCR to determine fold enrichment relative to input. One-way ANOVA statistical test was used to compare mean signal amplification between each treatment and vehicle-treated samples, applying the Bonferroni method to correct for multiple comparisons. Error bars represent the standard error of the mean (SEM) of two independent experiments with three technical replicates each. C) MCF7 cells were pre-incubated for 48 hours in steroid hormone-depleted medium and subsequently treated with BYL719 1 μM, estradiol 10 nM, or the combination over a period of 16 hours, and RNA was isolated at the indicated times. qPCR was performed to detect βACTIN, PGR, and GREB1 expression. The data are presented relative to βACTIN and to expression at time 0 in the BYL-treated samples. One-way ANOVA statistical test was used to compare gene expression between each treatment and vehicle-treated cells, applying the Bonferroni method to correct for multiple comparisons. The results presented are for the comparisons at the 16 hour time point. Error bars denote the SEM of two independent experiments with three technical replicates each. D) MCF7 cells, grown in normal serum conditions, were treated with BYL719 1 μM, alone or in combination with 4-hydroxytamoxifen 1 μM or fulvestrant 100 nM over a period of 16 hours. mRNA was isolated at the indicated times. qPCR was performed to detect βACTIN, PGR, and GREB1 expression. The data are presented relative to βACTIN and to expression at time 0 in the vehicle-treated samples. One-way ANOVA statistical test was used to compare gene expression between each treatment and vehicle-treated cells, applying the Bonferroni method to correct for multiple comparisons. The analysis results presented are for the comparisons at the 16 hour time point. Error bars denote the SEM of two independent experiments with three technical replicates each. BYL719 (BYL); estradiol (E2); 4-hydroxytamoxifen (4-OHT); fulvestrant (FULV)
Figure 4
Figure 4. Combination of BYL719 and fulvestrant in vivo induces prolonged responses
A) MCF7 in vivo xenograft was treated with vehicle, BYL719, fulvestrant, or the combination at the indicated doses and schedule. Graph shows the fold change in tumor volume with respect to day 0 of treatment. One-way ANOVA statistical test was performed to compare tumor volume fold change on the last day of treatment between each treatment arm and vehicle, applying the Bonferroni method to correct for multiple comparisons. Error bars represent standard error of the mean (SEM). B) ER-positive/PIK3CAmut patient-derived xenograft (PDX) bearing mice were randomized to receive treatment with indicated doses and schedules of vehicle, BYL719, and/or fulvestrant. Graph shows the fold change in tumor volume with respect to day 0 of treatment. One-way ANOVA statistical test was performed to compare tumor volume fold change on the last day of treatment between each treatment arm and vehicle, applying the Bonferroni method to correct for multiple comparisons. Error bars represent SEM. C) Pharmacodynamic study of MCF7 mouse xenograft. Mice were treated with vehicle, BYL719, fulvestrant, or the combination with the same dosing and schedule as in (A) for 4 days. Animals were sacrificed two hours after the last dose, and tumors processed for immunohistochemistry (IHC) and stained with the indicated antibodies. The figure shows representative images for each of the treatment arms. Scale bars 50 μm. D) A parallel pharmacodynamic study was performed with the ER-positive/PIK3CAmut PDX mice, which were treated with either vehicle or BYL719 with the same dosing and schedule as described in (B). Mice were sacrificed and tumors obtained on day 4, 2 hours after the last dose, and processed to obtain RNA for microarray gene expression analysis. Graph represents genes whose expression differed significantly across different treatments with a FDR ≤ 1%. Each of the columns under the experimental conditions represents one biological replicate. Venn diagram represents differentially regulated genes upon treatment with BYL719 (SAM analysis FDR ≤ 1%) and the percentage of these that contained an ER binding site, defined by ER ChIP-sequencing data available from (42). E) GSEA analysis was performed to determine which gene sets were enriched in the PDX microarray expression data set obtained in (D).Graph represents enrichment for ER-associated signature (FDR ≤ 25%) as described in (44). F) Pharmacodynamic studies on the MCF7 xenografts from (A) were performed on day 7 of treatment, by means of a punch biopsy in both vehicle and BYL-treated mice. A representative number of biopsies (at least two biological replicates per condition) was processed to obtain RNA and submitted for gene expression analysis. GSEA analysis was performed to determine which gene sets were enriched in our data set (FDR ≤ 25%). Graph represents enrichment for ER associated signature as described in (44). Vehicle (Ctrl); BYL719 (BYL); fulvestrant (FULV); combination (BYL+FULV).

References

    1. Engelman JA, Luo J, Cantley LC. The evolution of phosphatidylinositol 3-kinases as regulators of growth and metabolism. Nat Rev Genet. 2006;7:606–619. - PubMed
    1. Cantley LC. The phosphoinositide 3-kinase pathway. Science. 2002;296:1655–1657. - PubMed
    1. Engelman JA. Targeting PI3K signalling in cancer: opportunities, challenges and limitations. Nat Rev Cancer. 2009;9:550–562. - PubMed
    1. Brachmann SM, Ueki K, Engelman JA, Kahn RC, Cantley LC. Phosphoinositide 3-kinase catalytic subunit deletion and regulatory subunit deletion have opposite effects on insulin sensitivity in mice. Mol Cell Biol. 2005;25:1596–1607. - PMC - PubMed
    1. Zhao L, Vogt PK. Helical domain and kinase domain mutations in p110alpha of phosphatidylinositol 3-kinase induce gain of function by different mechanisms. Proc Natl Acad Sci U S A. 2008;105:2652–2657. - PMC - PubMed

Publication types

MeSH terms

Associated data