. 2015 May 6;12(106):20141389.
doi: 10.1098/rsif.2014.1389.

Investigating biomechanical noise in neuroblastoma cells using the quartz crystal microbalance

Affiliations

Investigating biomechanical noise in neuroblastoma cells using the quartz crystal microbalance

Abhinav Prasad et al. J R Soc Interface. .

Abstract

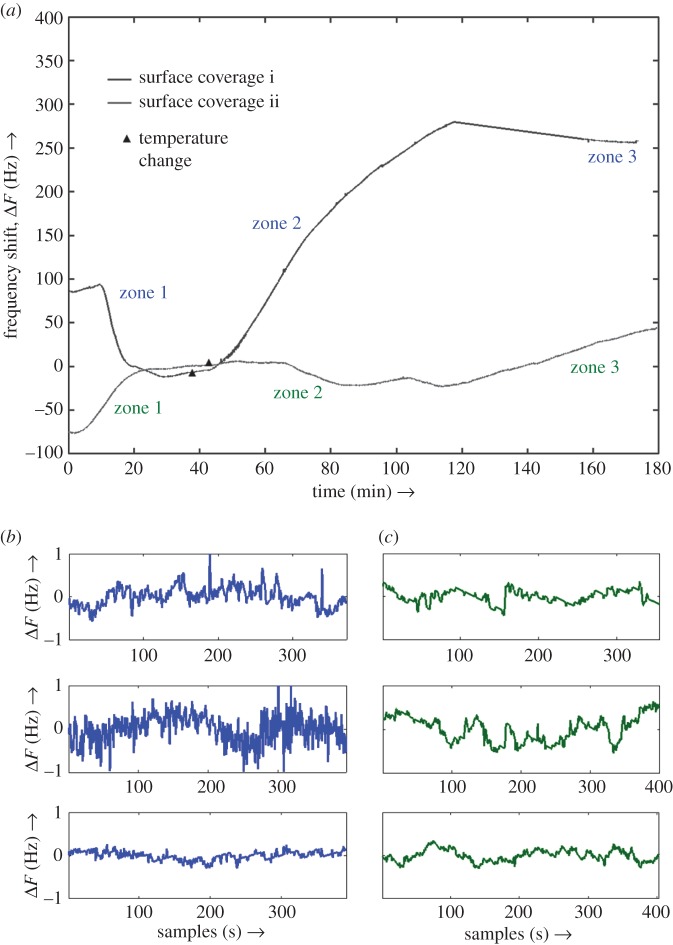
Quantifying cellular behaviour by motility and morphology changes is increasingly important in formulating an understanding of fundamental physiological phenomena and cellular mechanisms of disease. However, cells are complex biological units, which often respond to external environmental factors by manifesting subtle responses that may be difficult to interpret using conventional biophysical measurements. This paper describes the adaptation of the quartz crystal microbalance (QCM) to monitor neuroblastoma cells undergoing environmental stress wherein the frequency stability of the device can be correlated to changes in cellular state. By employing time domain analysis of the resulting frequency fluctuations, it is possible to study the variations in cellular motility and distinguish between different cell states induced by applied external heat stress. The changes in the frequency fluctuation data are correlated to phenotypical physical response recorded using optical microscopy under identical conditions of environmental stress. This technique, by probing the associated biomechanical noise, paves the way for its use in monitoring cell activity, and intrinsic motility and morphology changes, as well as the modulation resulting from the action of drugs, toxins and environmental stress.

Keywords: biomechanical noise; frequency stability; neuroblastoma cells; quartz crystal microbalance.


Figures

Figure 1.
Figure 1.
(a) Schematic of a quartz crystal top surface with circular Cr/Au electrode, and (b) cross-sectional schematic view of a SH-SY5Y human neuroblastoma cell adhering to the poly-l-lysine (PLL) coated crystal. (Relative dimensions not to scale.) (Online version in colour.)
Figure 2.
Figure 2.
(a) Frequency shift plots for two different surface coverages: 3.6% (surface coverage i) and 30.7% (surface coverage ii) of SH-SY5Y human neuroblastoma cells on different quartz crystals. Markers indicate the point of commencement in temperature increment of the flow-cell from 37°C to 45°C in order to apply heat shock to the adherent cells. Three different zones are also annotated which roughly define three different stages of the experiments. Zone 1 is where cells are healthy, zone 2 is immediately after the temperature is increased and represents transition to cell apoptosis, whereas zone 3 is the stage just before the experiment is concluded with final stages of apoptosis. Increase in frequency in both the cases indicates decrease in mass loading (i.e. cell detachment from the surface) with time. (b,c) (Two columns of three plots each.) Snapshots of frequency fluctuations in zone 1, zone 2 and zone 3 (top to bottom) for the two cases of varying surface coverage. In all cases, the trendline has been adjusted for representation purposes only. Note that in the case of larger surface coverage, the signal is more ‘noisy’ in zone 2, whereas it is least in zone 3. In the case of lower surface coverage, differences in the frequency fluctuations in three different zones are relatively smaller than the former case. (Online version in colour.)
Figure 3.
Figure 3.
(i,ii) Log–log overlapped Allan-deviation plots for the larger and smaller surface coverages respectively. From (i)—(i), it is quite evident that the fluctuation levels for all averaging times (τ) are highest for zone 2, intermediate for zone 1, whereas levels are lowest for zone 3. This indicates when cells are alive, owing to their activity, fluctuation levels are higher when compared with when cells are dead. Also, when cells are in a stressed state higher fluctuation levels are observed. (i): (ii–iv) Individual linear fitting curves (black, continuous and slightly offset for clarity) for three zones. Similarly, from (ii), (i) it is evident that while fluctuation levels for shorter averaging times are higher for both zone 1 and zone 2, fluctuation levels are only slightly higher for zone 2. Linear fitting (ii–iv) indicate nature of noises (power-law type) for different zones as in the previous case. (Online version in colour.)
Figure 4.
Figure 4.
(a,b) Log–log overlapped Allan-deviation plots for surface coverage iii (13%) and iv (22.5%), whereas (c,d) are overlapped Allan-deviation plots for control experiments. All the steps are common in control experiments with the exception of absence of any seeded cells. In (c), the surrounding media is DI water, whereas in (d) the surrounding media is cell culture. (Online version in colour.)
Figure 5.
Figure 5.
(ah) Phase-contrast optical images of cells seeded on a PLL-coated glass surface. Temperature is increased from 37°C to 45°C over a period of 150 min during which cells changes morphology, ultimately shrink and become round which is characteristic of apoptosis.
Figure 6.
Figure 6.
(ac) Phase-contrast images of SH-SY5Y cells at different time instances during the heating process. Coloured lines represent the tracks of various cells undergoing heat-induced stress. In (b), arrows are indicating the direction of motion of individual cells, whereas in (c), they are indicating the final positions of the cells. (d) Mean-square displacement plots of cells prior to the heat-stress phase of the experiment (first 16 min) indicating the presence of at least two categories of cell movements, fast and slow, while, a close fit to MSD(Δt) = 4DΔt + (νΔt)2 is performed to extract diffusion coefficients and speed values. Similarly, (e) is MSD log–log plot for the last stage of experiment (150th–190th min). (f) Mean and standard deviation values for normalized change in the cell spreading (apparent overlap area) of the cells under consideration are plotted against time which peak almost halfway through and then rapidly decrease until the cells become spherical. (g) Total surface coverage shows a similar trend. (Online version in colour.)

Similar articles

References

    1. Franz CM, Jones GE, Ridley AJ. 2002. Cell migration in development and disease. Dev. Cell 2, 153–158. (10.1016/S1534-5807(02)00120-X) - DOI - PubMed
    1. Wells A, Grahovac J, Wheeler S, Ma B, Lauffenburger D. 2013. Targeting tumor cell motility as a strategy against invasion and metastasis. Trends Pharmacol. Sci. 34, 283–289. (10.1016/j.tips.2013.03.001) - DOI - PMC - PubMed
    1. Ingber DE. 2003. Tensegrity I. Cell structure and hierarchical systems biology. J. Cell Sci. 116, 1157–1173. (10.1242/jcs.00359) - DOI - PubMed
    1. Mattila PK, Lappalainen P. 2008. Filopodia: molecular architecture and cellular functions. Nat. Rev. Mol. Cell Biol. 9, 446–454. (10.1038/nrm2406) - DOI - PubMed
    1. Brakebusch C, Fässler R. 2003. The integrin–actin connection, an eternal love affair. EMBO J. 22, 2324–2333. (10.1093/emboj/cdg245) - DOI - PMC - PubMed

LinkOut - more resources