

High molecular diversity in the true service tree (Sorbus domestica) despite rareness: data from Europe with special reference to the Austrian occurrence
- PMID: 25878141
- PMCID: PMC4648458
- DOI: 10.1093/aob/mcv047
High molecular diversity in the true service tree (Sorbus domestica) despite rareness: data from Europe with special reference to the Austrian occurrence
Abstract
Background and aims: Sorbus domestica (Rosaceae) is one of the rarest deciduous tree species in Europe and is characterized by a scattered distribution. To date, no large-scale geographic studies on population genetics have been carried out. Therefore, the aims of this study were to infer levels of molecular diversity across the major part of the European distribution of S. domestica and to determine its population differentiation and structure. In addition, spatial genetic structure was examined together with the patterns of historic and recent gene flow between two adjacent populations.
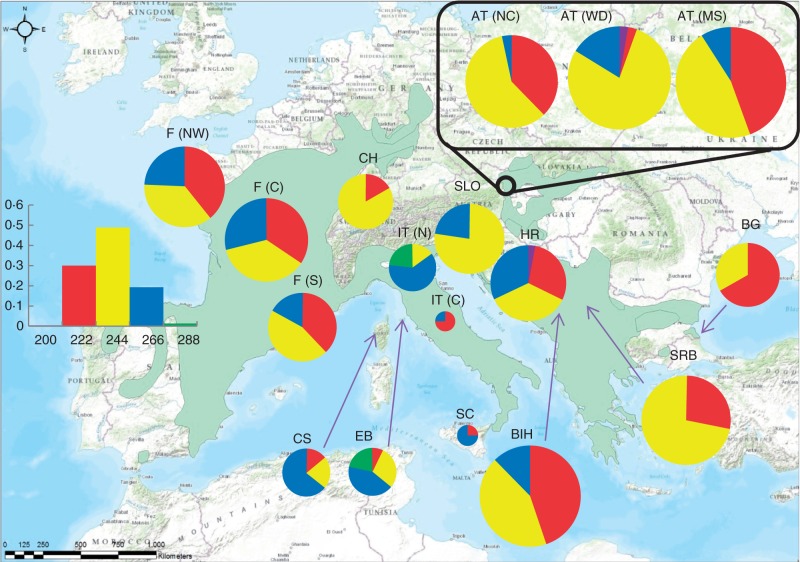
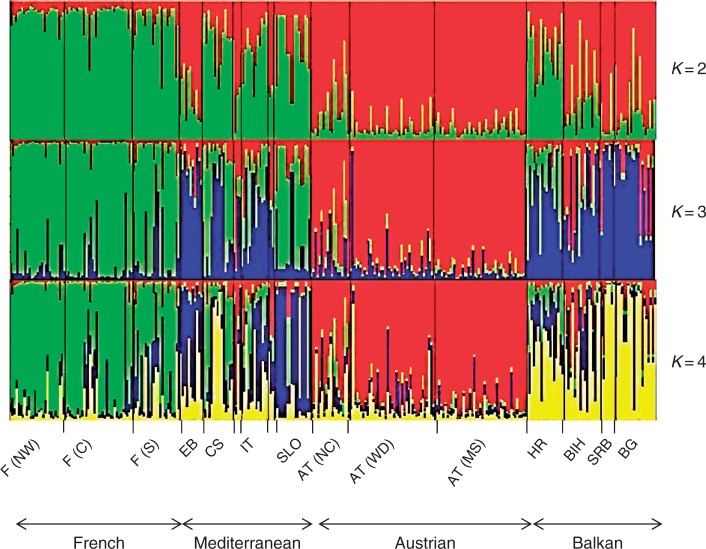
Methods: Leaf or cambium samples were collected from 17 populations covering major parts of the European native range from north-west France to south-east Bulgaria. Seven nuclear microsatellites and one chloroplast minisatellite were examined and analysed using a variety of methods.
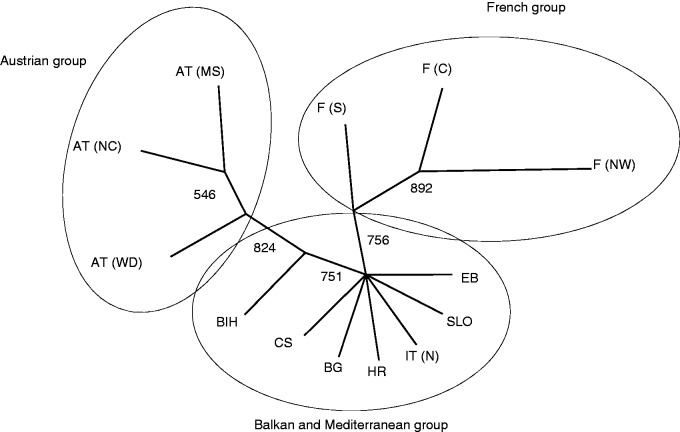
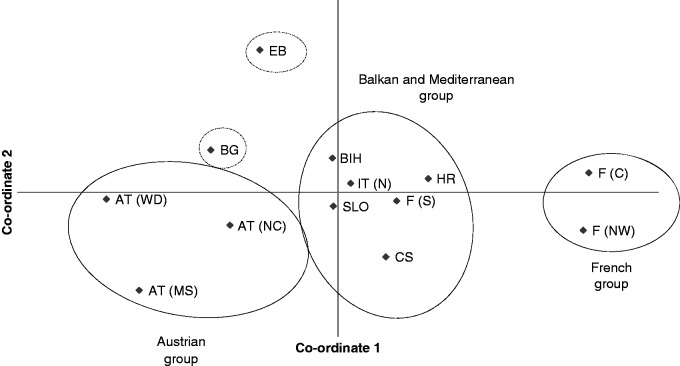
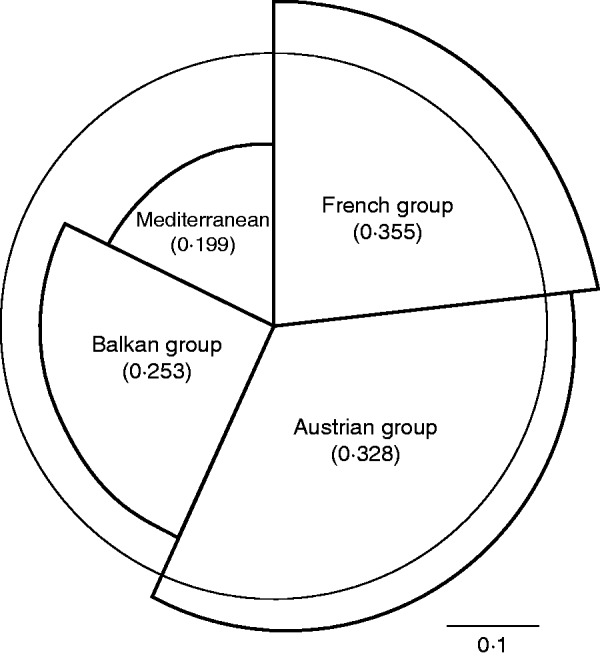
Key results: Allelic richness was unexpectedly high for both markers within populations (mean per locus: 3·868 for nSSR and 1·647 for chloroplast minisatellite). Moreover, there was no evidence of inbreeding (mean Fis = -0·047). The Italian Peninsula was characterized as a geographic region with comparatively high genetic diversity for both genomes. Overall population differentiation was moderate (FST = 0·138) and it was clear that populations formed three groups in Europe, namely France, Mediterranean/Balkan and Austria. Historic gene flow between two local Austrian populations was high and asymmetric, while recent gene flow seemed to be disrupted.
Conclusions: It is concluded that molecular mechanisms such as self-incompatibility and high gene flow distances are responsible for the observed level of allelic richness as well as for population differentiation. However, human influence could have contributed to the present genetic pattern, especially in the Mediterranean region. Comparison of historic and recent gene flow may mirror the progress of habitat fragmentation in eastern Austria.
Keywords: Chloroplast DNA; Rosaceae; Sorbus domestica; gene flow; genetic variability; habitat fragmentation; nuclear microsatellites; self-incompatibility; true service tree.
© The Author 2015. Published by Oxford University Press on behalf of the Annals of Botany Company. All rights reserved. For Permissions, please email: journals.permissions@oup.com.
Figures
Similar articles
-
Hybridization and polyploidy as drivers of continuing evolution and speciation in Sorbus.Mol Ecol. 2010 Apr;19(8):1675-90. doi: 10.1111/j.1365-294X.2010.04585.x. Epub 2010 Mar 12. Mol Ecol. 2010. PMID: 20345692
-
Genetic effects of chronic habitat fragmentation on tree species: the case of Sorbus aucuparia in a deforested Scottish landscape.Mol Ecol. 2004 Mar;13(3):573-84. doi: 10.1046/j.1365-294x.2004.02093.x. Mol Ecol. 2004. PMID: 14871362
-
Origin and genetic differentiation of pink-flowered Sorbus hybrids in the Western Carpathians.Ann Bot. 2017 Aug 1;120(2):271-284. doi: 10.1093/aob/mcx013. Ann Bot. 2017. PMID: 28334280 Free PMC article.
-
A variable minisatellite sequence in the chloroplast genome of Sorbus L. (Rosaceae: Maloideae).Genome. 2002 Jun;45(3):570-6. doi: 10.1139/g02-018. Genome. 2002. PMID: 12033626
-
The east-west-north colonization history of the Mediterranean and Europe by the coastal plant Carex extensa (Cyperaceae).Mol Ecol. 2010 Jan;19(2):352-70. doi: 10.1111/j.1365-294X.2009.04449.x. Epub 2009 Dec 9. Mol Ecol. 2010. PMID: 20002603
Cited by
-
Nutrient Constituents, Bioactive Phytochemicals, and Antioxidant Properties of Service Tree (Sorbus domestica L.) Fruits.Plants (Basel). 2022 Jul 13;11(14):1832. doi: 10.3390/plants11141832. Plants (Basel). 2022. PMID: 35890466 Free PMC article.
-
Limiting inbreeding in disjunct and isolated populations of a woody shrub.Ecol Evol. 2016 Jul 25;6(16):5867-80. doi: 10.1002/ece3.2322. eCollection 2016 Aug. Ecol Evol. 2016. PMID: 27547361 Free PMC article.
-
Recent Large-Scale Genotyping and Phenotyping of Plant Genetic Resources of Vegetatively Propagated Crops.Plants (Basel). 2021 Feb 23;10(2):415. doi: 10.3390/plants10020415. Plants (Basel). 2021. PMID: 33672381 Free PMC article. Review.
-
Overview of Ethnobotanical-Pharmacological Studies Carried Out on Medicinal Plants from the Serra da Estrela Natural Park: Focus on Their Antidiabetic Potential.Pharmaceutics. 2024 Mar 25;16(4):454. doi: 10.3390/pharmaceutics16040454. Pharmaceutics. 2024. PMID: 38675115 Free PMC article. Review.
-
Cryptic population structure at the northern range margin of the service tree Sorbus domestica.PeerJ. 2022 Dec 5;10:e14397. doi: 10.7717/peerj.14397. eCollection 2022. PeerJ. 2022. PMID: 36523464 Free PMC article.
References
-
- Angelone S, Hilfiker K, Holderegger R, Bergamini A, Hoebee S. 2007. Regional population dynamics define the local genetic structure in Sorbus torminalis. Molecular Ecology 16: 1291–1301. - PubMed
-
- Balloux F, Lugon-Moulin N. 2002. The estimation of population differentiation with microsatellite markers. Molecular Ecology 11: 155–165. - PubMed
-
- Bariteau M, Brahic P, Thevenet J. 2006. Comment domestiquer le Cormier (Sorbus domestica)? Bilan des recherchessur la multiplication sexuee et vegetative . Foret mediterraneenne 27: 17–30.
-
- Beerli P. 2006. Comparison of Bayesian and maximum-likelihood inference of population genetic parameters. Bioinformatics 22: 341–345. - PubMed
-
- Beerli P. 2004. Effects of unsampled populations on the estimation of population sizes and migration rates between sampled populations. Molecular Ecology 13: 827–836. - PubMed
MeSH terms
Substances
LinkOut - more resources
Full Text Sources
Other Literature Sources
Miscellaneous
