. 2015 Apr 15;75(8):1567-79.
doi: 10.1158/0008-5472.CAN-14-1428.

Impact of metabolic heterogeneity on tumor growth, invasion, and treatment outcomes

Affiliations

Impact of metabolic heterogeneity on tumor growth, invasion, and treatment outcomes

Mark Robertson-Tessi et al. Cancer Res. .

Abstract

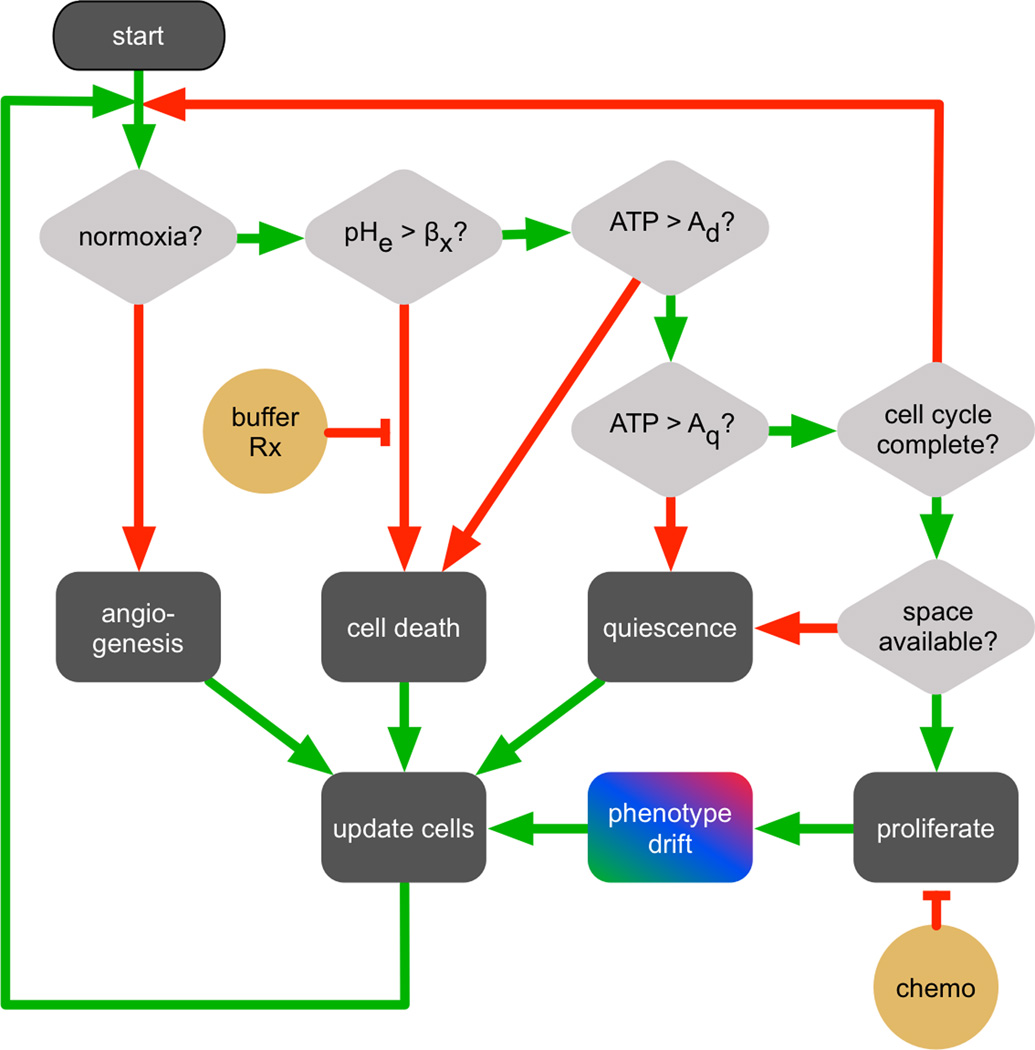
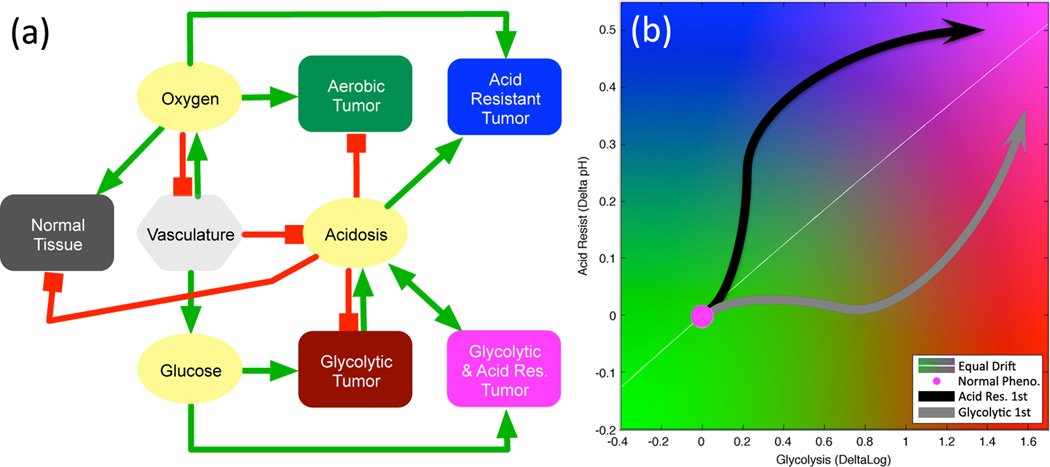
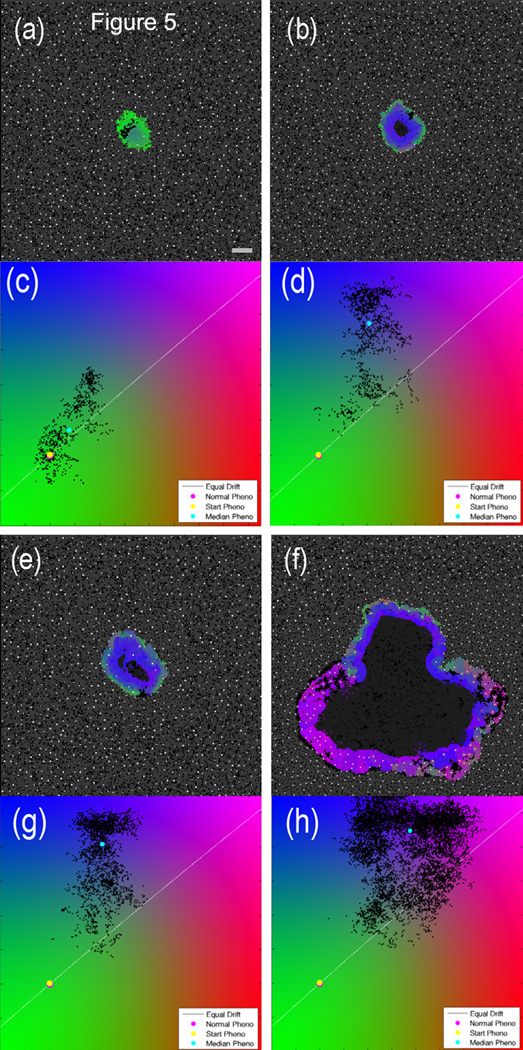
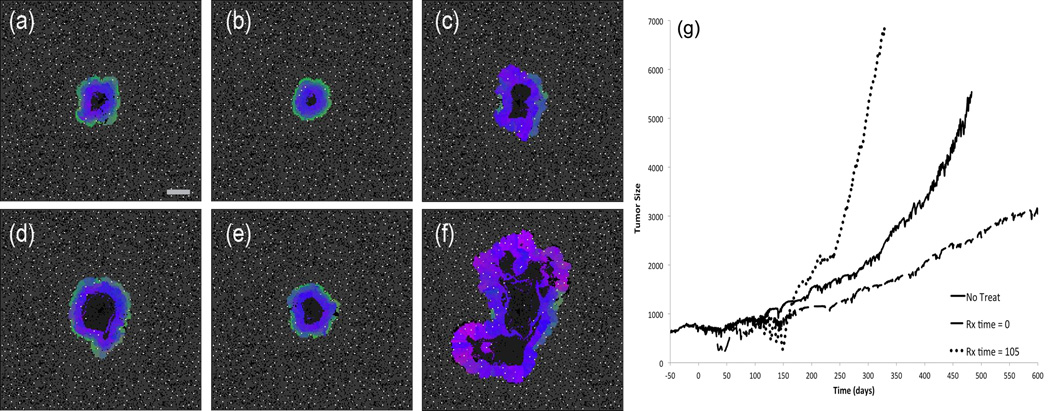
Histopathologic knowledge that extensive heterogeneity exists between and within tumors has been confirmed and deepened recently by molecular studies. However, the impact of tumor heterogeneity on prognosis and treatment remains as poorly understood as ever. Using a hybrid multiscale mathematical model of tumor growth in vascularized tissue, we investigated the selection pressures exerted by spatial and temporal variations in tumor microenvironment and the resulting phenotypic adaptations. A key component of this model is normal and tumor metabolism and its interaction with microenvironmental factors. The metabolic phenotype of tumor cells is plastic, and microenvironmental selection leads to increased tumor glycolysis and decreased pH. Once this phenotype emerges, the tumor dramatically changes its behavior due to acid-mediated invasion, an effect that depends on both variations in the tumor cell phenotypes and their spatial distribution within the tumor. In early stages of growth, tumors are stratified, with the most aggressive cells developing within the interior of the tumor. These cells then grow to the edge of the tumor and invade into the normal tissue using acidosis. Simulations suggest that diffusible cytotoxic treatments, such as chemotherapy, may increase the metabolic aggressiveness of a tumor due to drug-mediated selection. Chemotherapy removes the metabolic stratification of the tumor and allows more aggressive cells to grow toward blood vessels and normal tissue. Antiangiogenic therapy also selects for aggressive phenotypes due to degradation of the tumor microenvironment, ultimately resulting in a more invasive tumor. In contrast, pH buffer therapy slows down the development of aggressive tumors, but only if administered when the tumor is still stratified. Overall, findings from this model highlight the risks of cytotoxic and antiangiogenic treatments in the context of tumor heterogeneity resulting from a selection for more aggressive behaviors.


Conflict of interest statement

No relevant Conflict of Interest to disclose

Figures

Figure 1
Figure 1
CA decision process for each cell, with diamonds representing decisions, green arrows meaning the condition is satisfied, and red meaning the condition is not met. Therapies are shown in yellow.
Figure 2
Figure 2
(a) Model interaction network for diffusible molecules (yellow), vasculature (light gray) , normal tissue (dark gray), and variable tumor phenotypes (colors). Red lines show negative or inhibitory interactions and green lines show positive or productive interactions. (b) A flow map of tumor phenotype space. The horizontal axis is the constitutively activated log-glycolytic capacity (log pG), and vertical axis is the change in acid resistance (−ΔβT) from normal, with higher resistance to acidic conditions being higher on the plot. The normal metabolic phenotype is at the origin (magenta circle), while the arrows represent two possible routes to reach the aggressive state of high glycolysis and high acid-resistance, as discussed in section 3.1. The white line shows the equal maximal variation, such that a cell acquiring maximal positive changes in glycolytic capacity and acid-resistance on each division would move along this line in phenotype space.
Figure 3
Figure 3
(a–h) Representative simulation of tumor growth with time points (in days): (a/b)=1270, (c/d)=1392, (e/f)=1610, and (g/h)=1912. Scale bar is 400 microns. Video available on the online supplemental section (Video 1). (Left column): The 2D CA model output with vasculature (white), empty space (black), necrosis (dark gray), normal tissue (medium gray) and tumor cells labeled with colors corresponding with the cell position on the phenotype flow diagram of the right column. (Right column): Distribution of tumor cells along two phenotype axes, as described in Fig. 2, with starting (yellow) and median (cyan) tumor phenotype. (i) Growth curve for the simulation. (j) Radial pHe and tumor growth from a murine dorsal window chamber [4]. The pH at the tumor edge was measured at multiples of 22.5 degrees and compared to the tumor growth at the same angular positions over 10 days. (k) Radial pHe and tumor growth from the simulation by sampling the pH around the tumor edge and measuring the radial growth rate.
Figure 4
Figure 4
Comparison of three pH buffering simulations with identical initial conditions at two different time points. The left column is an untreated simulation; the central column is continuously treated with sodium bicarbonate starting at trel=0 days; the right column starts treatment at trel=75 days. The top panels (a–f) show the state of the three simulations at trel=78 days, i.e. shortly after the tumor in the right column has started the buffer therapy. The bottom set of panels (g–l) shows the state of the tumors at trel=142 days. Scale bar is 400 microns. Video available on the online supplemental section (Video 2).
Figure 5
Figure 5
Comparison of untreated and anti-angiogenic therapy simulations with identical initial conditions at two different time points. The left column is untreated; the right column has anti-angiogenic treatment at trel=0 days. The top panels (a – d) show the state at trel=141 days, i.e. 141 days after the start of therapy in the right panel. The bottom set of panels (e – h) is at trel=285 days. Scale bar is 400 microns. Video available on the online supplemental section (Video 3).
Figure 6
Figure 6
(a–f) Comparison of untreated and chemotherapy simulations with identical initial conditions at two different time points. The left column is an untreated simulation; the central column was pulsed with cytotoxic therapy starting at trel=0; the right column starts the identical treatment at trel=105. The top panels (a–c) show the state of the three simulations at trel=264, i.e. shortly after the tumor in the right column has finished the therapy. The bottom set of panels (d – f) shows the state of the tumors at trel=380. Scale bar is 400 microns. Video available on the online supplemental section (Video 4). (g) Growth curves for untreated (solid), early (dashed), and late (dotted) chemotherapy from (a–f). Tumor size on the vertical axis is the diameter in microns.

References

    1. Dowling MR, Kan A, Heinzel S, Zhou JH, Marchingo JM, Wellard CJ, et al. Stretched cell cycle model for proliferating lymphocytes. Proc. Nat. Acad. Sci. 2014;111(17):6377–6382. - PMC - PubMed
    1. Smallbone K, Gatenby R, Gillies R, Maini P, Gavaghan D. Metabolic changes during carcinogenesis: potential impact on invasiveness. J. Theor. Biol. 2007;244(4):703–713. - PubMed
    1. Macklin P, Edgerton ME, Thompson AM, Cristini V. Patient-calibrated agent-based modelling of ductal carcinoma in situ (DCIS): From microscopic measurements to macroscopic predictions of clinical progression. Journal of theoretical biology. 2012;301:122–140. - PMC - PubMed
    1. Estrella V, Chen T, Lloyd M, Wojtkowiak J, Cornnell HH, Ibrahim-Hashim A, et al. Acidity generated by the tumor microenvironment drives local invasion. Cancer Res. 2013;73(5):1524–1535. - PMC - PubMed
    1. Wojtkowiak JW, Rothberg JM, Kumar V, Schramm KJ, Haller E, Proemsey JB, et al. Chronic autophagy is a cellular adaptation to tumor acidic pH microenvironments. Cancer Res. 2012;72(16):3938–3947. - PMC - PubMed

Publication types

Substances