

Balancing out dwelling and moving: optimal sensorimotor synchronization
- PMID: 25878154
- PMCID: PMC4507973
- DOI: 10.1152/jn.00175.2015
Balancing out dwelling and moving: optimal sensorimotor synchronization
Abstract
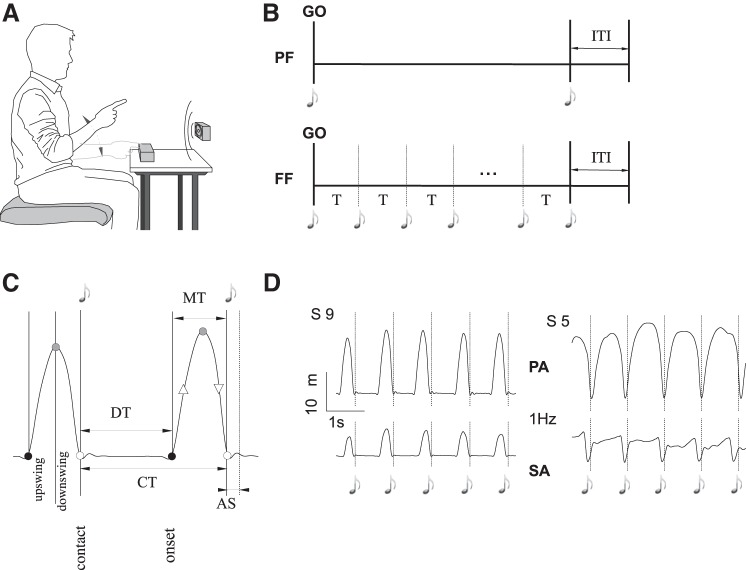
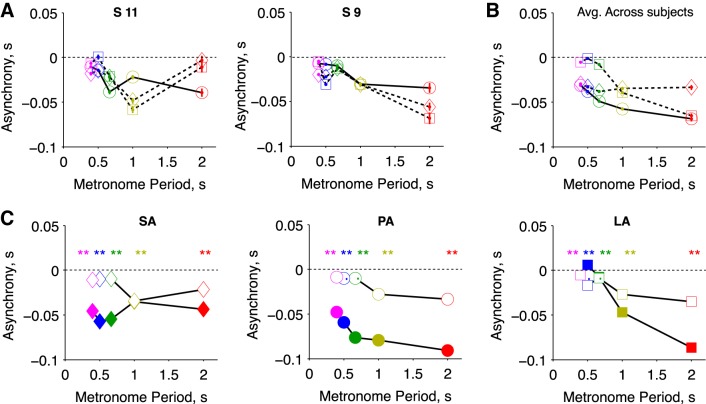
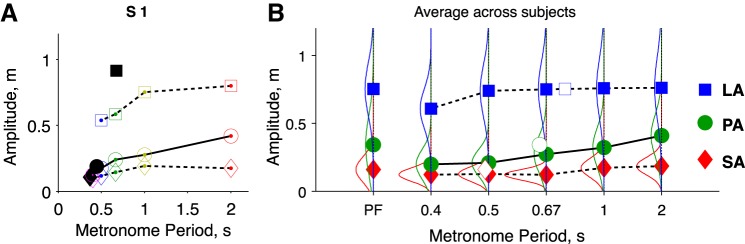
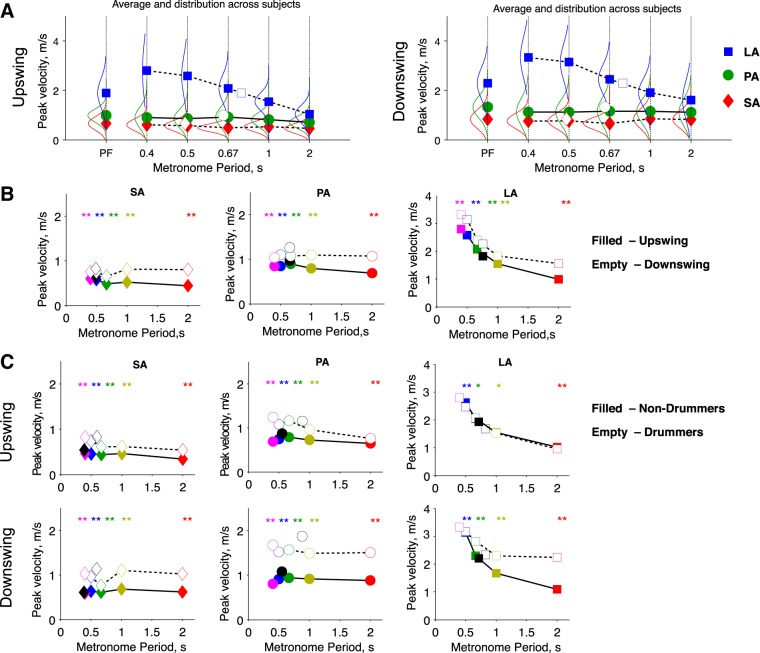
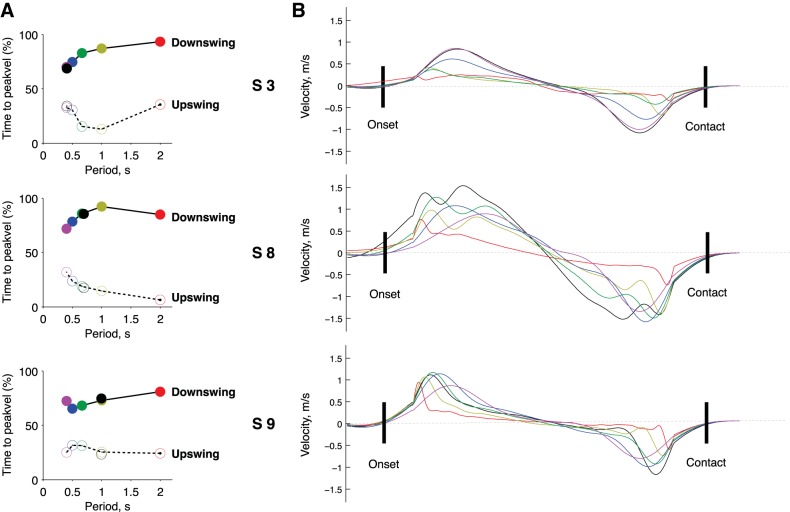
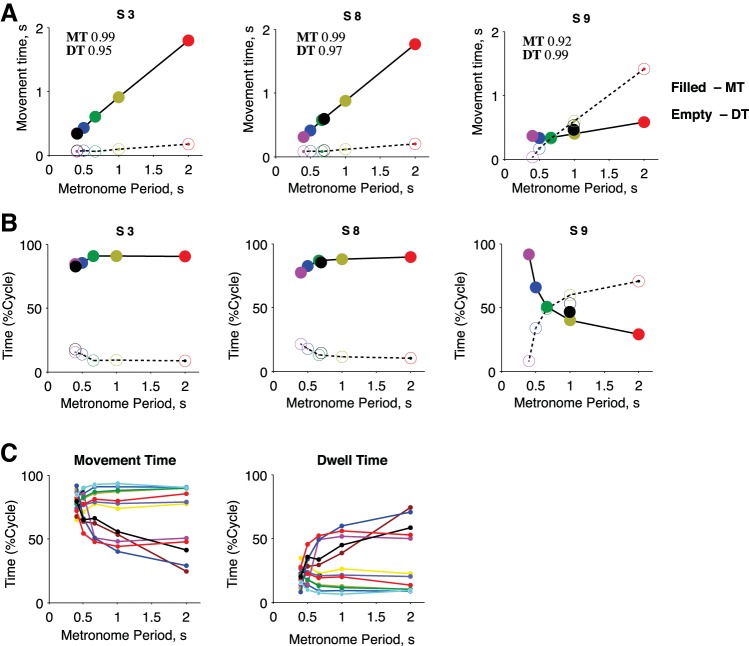
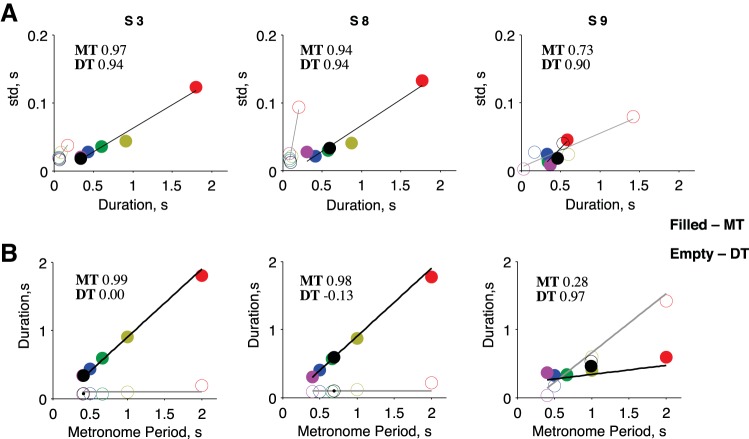
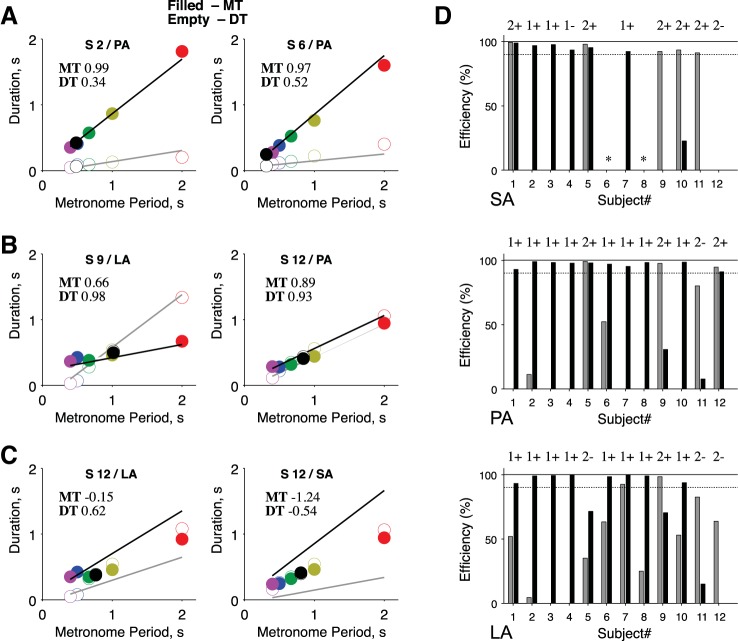
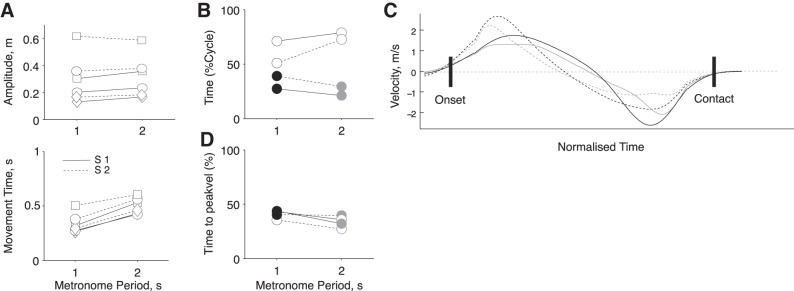
Sensorimotor synchronization is a fundamental skill involved in the performance of many artistic activities (e.g., music, dance). After a century of research, the manner in which the nervous system produces synchronized movements remains poorly understood. Typical rhythmic movements involve a motion and a motionless phase (dwell). The dwell phase represents a sizable fraction of the rhythm period, and scales with it. The rationale for this organization remains unexplained and is the object of this study. Twelve participants, four drummers (D) and eight nondrummers (ND), performed tapping movements paced at 0.5-2.5 Hz by a metronome. The participants organized their tapping behavior into dwell and movement phases according to two strategies: 1) Eight participants (1 D, 7 ND) maintained an almost constant ratio of movement time (MT) and dwell time (DT) irrespective of the metronome period. 2) Four participants increased the proportion of DT as the period increased. The temporal variabilities of both the dwell and movement phases were consistent with Weber's law, i.e., their variability increased with their durations, and the longest phase always exhibited the smallest variability. We developed an optimal statistical model that formalized the distribution of time into dwell and movement intervals as a function of their temporal variability. The model accurately predicted the participants' dwell and movement durations irrespective of their strategy and musical skill, strongly suggesting that the distribution of DT and MT results from an optimization process, dependent on each participant's skill to predict time during rest and movement.
Keywords: motor control; optimality; psychophysics; rhythmic movements; synchronization.
Copyright © 2015 the American Physiological Society.
Figures
Similar articles
-
Intrinsic constraint of asymmetry acting as a control parameter on rapid, rhythmic bimanual coordination: a study of professional drummers and nondrummers.J Neurophysiol. 2010 Oct;104(4):2178-86. doi: 10.1152/jn.00882.2009. Epub 2010 Aug 11. J Neurophysiol. 2010. PMID: 20702735 Free PMC article.
-
Sensorimotor synchronization: a review of recent research (2006-2012).Psychon Bull Rev. 2013 Jun;20(3):403-52. doi: 10.3758/s13423-012-0371-2. Psychon Bull Rev. 2013. PMID: 23397235 Review.
-
The primacy of rhythm: how discrete actions merge into a stable rhythmic pattern.J Neurophysiol. 2019 Feb 1;121(2):574-587. doi: 10.1152/jn.00587.2018. Epub 2018 Dec 19. J Neurophysiol. 2019. PMID: 30565969 Free PMC article.
-
Poor synchronization to the beat may result from deficient auditory-motor mapping.Neuropsychologia. 2013 Aug;51(10):1952-63. doi: 10.1016/j.neuropsychologia.2013.06.027. Epub 2013 Jul 6. Neuropsychologia. 2013. PMID: 23838002
-
Sensorimotor synchronization: a review of the tapping literature.Psychon Bull Rev. 2005 Dec;12(6):969-92. doi: 10.3758/bf03206433. Psychon Bull Rev. 2005. PMID: 16615317 Review.
References
-
- Agostino R, Currà A, Giovannelli M, Modugno N, Manfredi M, Berardelli A. Impairment of individual finger movements in Parkinson's disease. Mov Disord 18: 560–565, 2003. - PubMed
-
- Aschersleben G, Prinz W. Synchronizing actions with events: the role of sensory information. Percept Psychophys 57: 305–317, 1995. - PubMed
-
- Baath R, Madison G. The subjective difficulty of tapping to a slow beat. In: Proceedings of 12th International Conference on Music Perception and Cognition, p. 82–85, 2012.
-
- Balasubramaniam R, Wing AM, Daffertshofer A. Keeping with the beat: movement trajectories contribute to movement timing. Exp Brain Res 159: 129–134, 2004. - PubMed
Publication types
MeSH terms
LinkOut - more resources
Full Text Sources
Other Literature Sources
Miscellaneous