. 2015 May 29;290(22):14077-90.
doi: 10.1074/jbc.M115.649640. Epub 2015 Apr 15.

Caspase-dependent Proteolysis of Human Ribonucleotide Reductase Small Subunits R2 and p53R2 during Apoptosis

Affiliations

Caspase-dependent Proteolysis of Human Ribonucleotide Reductase Small Subunits R2 and p53R2 during Apoptosis

Ali Tebbi et al. J Biol Chem. .

Abstract

Ribonucleotide reductase (RnR) is a key enzyme synthesizing deoxyribonucleotides for DNA replication and repair. In mammals, the R1 catalytic subunit forms an active complex with either one of the two small subunits R2 and p53R2. Expression of R2 is S phase-specific and required for DNA replication. The p53R2 protein is expressed throughout the cell cycle and in quiescent cells where it provides dNTPs for mitochondrial DNA synthesis. Participation of R2 and p53R2 in DNA repair has also been suggested. In this study, we investigated the fate of the RnR subunits during apoptosis. The p53R2 protein was cleaved in a caspase-dependent manner in K-562 cells treated with inhibitors of the Bcr-Abl oncogenic kinase and in HeLa 229 cells incubated with TNF-α and cycloheximide. The cleavage site was mapped between Asp(342) and Asn(343). Caspase attack released a C-terminal p53R2 peptide of nine residues containing the conserved heptapeptide essential for R1 binding. As a consequence, the cleaved p53R2 protein was inactive. In vitro, purified caspase-3 and -8 could release the C-terminal tail of p53R2. Knocking down these caspases, but not caspase-2, -7, and -10, also inhibited p53R2 cleavage in cells committed to die via the extrinsic death receptor pathway. The R2 subunit was subjected to caspase- and proteasome-dependent proteolysis, which was prevented by siRNA targeting caspase-8. Knocking down caspase-3 was ineffective. Protein R1 was not subjected to degradation. Adding deoxyribonucleosides to restore dNTP pools transiently protected cells from apoptosis. These data identify RnR activity as a prosurvival function inactivated by proteolysis during apoptosis.

Keywords: apoptosis; caspase; nucleoside/nucleotide biosynthesis; protein degradation; ribonucleotide reductase.


Figures

FIGURE 1.
FIGURE 1.
Proteolysis of p53R2 in K-562 leukemia cells after treatment with a Bcr-Abl inhibitor. A, cells were incubated for 40 h with the indicated concentrations of imatinib to induce cellular apoptosis. The immunoblot shows the R1 and p53R2 ribonucleotide reductase subunit protein levels. A smaller p53R2 fragment only observed in imatinib-treated cells is indicated by an arrow. α-Tubulin is a loading control. B, quantification of the smaller p53R2 fragment as detected in A by near-infrared immunofluorescence in percentage of total p53R2 polypeptides. Results are mean ± S.E. (error bars) of three determinations. C, immunoblot showing the time course effect of 2 μm imatinib on p53R2 proteolysis as well as R1 and R2 levels. D, quantification of the p53R2 proteolytic fragment as shown in C (n = 3). E, variations in protein R1, R2, and total protein p53R2 levels as depicted in C relative to their expression measured at t = 0.
FIGURE 2.
FIGURE 2.
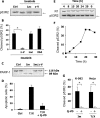
Potent inhibition of p53R2 proteolysis by two pan-caspase inhibitors. A, K-562 cells were cultured for 40 h with or without 2 μm imatinib. Effects of the proteasome inhibitor lactacystin (Lac) at 2.5 μm and the pan-caspase inhibitor z-VAD (z-V) at 50 μm on p53R2 proteolysis (arrow) were evaluated by immunoblotting. B, conditions as described in A except that the calpain and cathepsin inhibitor E-64-D (E64) was also tested at a concentration of 5 μm. Cleavage of p53R2 was measured as described in Fig. 1. Results are mean ± S.E. (error bars) of three independent experiments. *, p < 0.01. C, representative immunoblot in duplicates showing cleavage of the caspase substrate PARP-1 induced by imatinib treatment of K-562 cells and inhibited by 50 μm z-VAD. Native PARP-1 (116 kDa) and its smaller proteolytic fragment (85 kDa) are indicated. D, apoptosis of HeLa 229 cells was induced by TNF-α (10 ng/ml) and CHX (10 μg/ml) treatment for 16 h. Apoptotic nuclei detected by fluorescence microscopy were counted to estimate the extent of apoptosis. The general caspase inhibitor Q-VD-OPh (Q-VD) at 2 μm efficiently inhibited apoptosis. E, immunoblot showing invariant R1 expression and p53R2 proteolysis (arrow) in HeLa 229 cells after apoptosis induction as described in D. F, quantification of the p53R2 cleavage shown in E. G, evaluation of p53R2 proteolysis induced by treatment of K-562 and HeLa 229 cells with 2 μm imatinib (Im) for 33 h or TNF-α and CHX (T/X) for 20 h, respectively. Results are mean ± S.E. (error bars) of at least three independent experiments. *, p < 0.01. Ctrl, control.
FIGURE 3.
FIGURE 3.
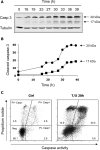
Treatments that lead to p53R2 cleavage also induce caspase activation. A and B, time course of caspase-3 activation in K-562 cells cultured with 2 μm imatinib. An immunoblot of active caspase-3 fragments (A) and corresponding quantification in arbitrary fluorescence units (B) are shown. C, detection of active caspases in HeLa cells incubated for 20 h in the presence of TNF-α (10 ng/ml) and CHX (10 μg/ml). Cells were labeled with propidium iodide (PI) and the caspase-specific FAM-VAD-fmk probe (Casp). Viable unlabeled cells (Neg), necrotic cells (PI+ Casp−), and early (PICasp+) or late (PI+ Casp+) apoptotic cells were quantified by flow cytometry. Numbers indicate the percentage of cells in each category. Biparameter diagrams are representative of three experiments. T/X, TNF-α and CHX; Ctrl, control.
FIGURE 4.
FIGURE 4.
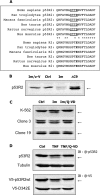
Identification of the caspase cleavage site on p53R2. A, sequence alignments of the last C-terminal 20 amino acid residues of p53R2 and R2 proteins from different species. The putative caspase cleavage site in p53R2 sequences is underlined. The P1 aspartic acid residue in p53R2 and the corresponding glutamic acid at the same position in R2 sequences are in bold. Asterisks indicate p53R2 residues conserved in R2 C-terminal ends. B, identical electrophoretic migration of ectopic p53R2-ΔC9 protein (ΔC9) expressed in untreated K-562 cells and endogenous p53R2 protein cleaved in K-562 cells incubated for 40 h with 2 μm imatinib (Im). Only full-length p53R2 is detected in untreated cells (Ctrl) or after treatment with imatinib and z-VAD (Im/z-V). The arrow indicates the proteolytic fragment of p53R2. C, K-562 cells or clones 3 and 19 derived from the K-562 cell line and stably expressing the p53R2-ΔC9 protein were subjected to a treatment with 5 μm imatinib (Im) or with imatinib and the caspase inhibitor Q-VD-OPh (Im/Q-VD) at 2 μm for 37 h. Immunoblots of p53R2 show that ectopic p53R2-ΔC9 is resistant to caspase-dependent cleavage. D, upper panel, cleavage of p53R2 (arrow) induced in H-1299 cells by treatment with TNF-α (10 ng/ml) and CHX (10 μg/ml) for 19 h (TNF). The caspase inhibitor Q-VD-OPh (Q-VD) at 2 μm prevented p53R2 proteolysis. Ctrl, untreated control. The immunoblot was probed with an anti-p53R2 antibody detected with an IRDye 800CW-conjugated secondary antibody (IB: @-p53R2). Lower panel, H-1299 cells expressing ectopic V5-p53R2WT or V5-p53R2-D342E (V5-D342E) proteins were incubated under the conditions described above. The immunoblot was probed with an anti-V5 antibody labeled with an Alexa Fluor 680-conjugated secondary antibody (IB: @-V5). The endogenous p53R2 protein was not detected under these conditions. Only the V5-p53R2-D342E mutant was resistant to caspase-dependent proteolysis.
FIGURE 5.
FIGURE 5.
Cleavage of p53R2 is caspase-3- and caspase-8-dependent. A, immunoblot of p53R2 (top) and its quantification (bottom) using K-562 cells after treatment with 2 μm imatinib in the presence or absence of caspase inhibitors with different specificities: z-VAD-fmk (z-VAD), Ac-IETD-CHO (IETD), Ac-DEVD-CHO (DEVD), Ac-VDVAD-CHO (VDVAD), and Ac-YVAD-CHO (YVAD). The cleaved p53R2 fragment is indicated by an arrow. Only the caspase-1 inhibitor Ac-YVAD-CHO was ineffective on p53R2 proteolysis. Ctrl, untreated control cells. B, p53R2 protein expression after treatment of MCF-7vc and MCF-7c3 cells for 16 h with 25 μg/ml cisplatin (Cp) in the presence (Cp/z-V) or absence of z-VAD at 50 μm. The arrow indicates the p53R2 polypeptide cleaved in a caspase-dependent manner. Below this cleavage product, a less abundant, z-VAD-fmk-insensitive proteolytic fragment (*) appears in all cisplatin-treated cell extracts. One representative experiment of four is shown. C and D, immunoblotting of p53R2 after incubation of HeLa 229 cells with TNF-α and CHX (T/X) for 24 h. In one sample, the pan-caspase inhibitor Q-VD-OPh (Q-VD) was added at 2 μm. Forty-eight hours prior to treatment by TNF-α and CHX, cells were transfected with siRNA targeting caspase-2 (siC2), caspase-3 (siC3), caspase-7 (siC7), caspase-8 (siC8), or caspase-10 (siC10). E, quantification of p53R2 proteolysis induced by a treatment of HeLa 229 cells with TNF-α and CHX and showing the protective effect of siRNAs against caspase-3 (siC3) or caspase-8 (siC8) compared with a scrambled siRNA control (siCtrl). Results are mean ± S.E. (error bars) of three independent experiments. *, p < 0.01.
FIGURE 6.
FIGURE 6.
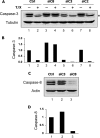
Efficacy of the siRNAs targeting caspase-3 and caspase-8. HeLa 229 cells were transfected with an siRNA directed against caspase-2 (siC2), -3 (siC3), or -8 (siC8) messengers. Forty hours later, TNF-α and CHX (T/X) were added in some cultures as indicated (A and B), and cells were harvested after a further 20-h period. Immunoblots of the 32-kDa caspase-3 zymogen (A) and the caspase-8 doublet (C) and their quantification relative to the respective loading controls α-tubulin (B) and β-actin (D) are presented. * indicates a nonspecific band below procaspase-3. Ctrl, control.
FIGURE 7.
FIGURE 7.
Proteolytic cleavage of the p53R2 protein induced by purified caspase-3 and -8. A, a whole cell extract of H1299 cells was incubated for 1, 2, or 4 h as indicated without (Ctrl) or with 500 ng of recombinant caspase-8 (C8-500) or ng (C3-400) or 800 ng (C3-800) of caspase-3. The immunoblot shows a caspase-dependent cleavage product of p53R2 (upper panel, lower band) and PARP (lower panel, arrow). B, quantification of p53R2 proteolysis as shown in A. C, immunoblots showing purified full-length p53R2 protein (p53R2WT), the C-terminal truncated p53R2-ΔC9 protein (ΔC9), or the caspase-resistant p53R2-D342E mutant after incubation with recombinant caspase-3 or caspase-8 for up to 4 h as indicated. The cleavage product of p53R2 has the same electrophoretic mobility as p53R2-ΔC9 and is indicated by an arrow. D, quantification of p53R2WT (filled symbols) or p53R2-D342E (open symbols) proteolysis in the presence of caspase-3 (squares) or caspase-8 (circles) as a function of time. One experiment repeated twice is shown.
FIGURE 8.
FIGURE 8.
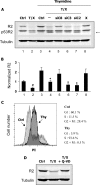
Caspase-dependent proteolysis of the R2 RnR subunit in HeLa 229 cells. A, cells were transfected or not (Ctrl) with siRNA targeting caspase-2 (siC2), -3 (siC3), or -8 (siC8) and synchronized in S phase with a double thymidine block. Asynchronous cultures were also tested for comparison (first two lanes on the left). Apoptosis was induced by TNF-α and CHX (T/X). A sample was incubated with CHX alone (X). Expression of the p53R2 and R2 RnR subunits was analyzed by immunoblotting. Protein R2 was probed with the I-15 antibody. An arrow indicates the p53R2 cleavage product. α-Tubulin is used as a loading control. Note that R2 expression increases more than 2-fold in cells blocked in S phase in agreement with the known regulation of the protein in the cell cycle. B, samples as shown in A. R2 expression was quantified relative to the asynchronous control and to the α-tubulin loading control. Results are mean ± S.E. (error bars) of three experiments. # and *, p < 0.05 versus asynchronous or thymidine-blocked control cells, respectively, as determined by Student's t test. C, cells were synchronized in S phase by a double thymidine block (Thy) or grown as asynchronous cultures (Ctrl). Cells fixed in cold ethanol were labeled with 10 μg/ml propidium iodide (PI), and cell cycle distribution was analyzed by flow cytometry. D, cells were synchronized in S phase before treatment for 22 h with TNF-α and CHX (T/X) with or without the caspase inhibitor Q-VD-OPh (Q-VD) added at 2 μm. Expression of protein R2 was evaluated by immunoblotting.
FIGURE 9.
FIGURE 9.
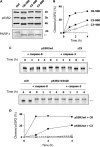
Shortened half-life of protein R2 in HeLa 229 cells undergoing apoptosis. Cells were first synchronized in S phase prior to any other treatment. Thymidine at 2 mm was maintained in the culture medium until the end of the experiment to keep cells in S phase. The E-16 antibody was used to detect protein R2 by immunoblotting. A, cells were incubated in medium alone (Ctrl), with CHX (10 μg/ml), or with TNF-α (10 ng/ml) and CHX for 22 h with or without MG-132 at 20 μm. Expression of protein R2 was analyzed by immunoblotting. The smaller R2 cleavage product present in apoptotic cells treated with TNF and CHX is indicated by an arrow. Proteasome inhibition by MG-132 protected R2 from degradation in apoptotic cells. B, cells transfected or not with a caspase-8-specific siRNA were incubated with TNF and CHX (T/X) and with (MG) or without MG-132 as described in A. Knocking down caspase-8 inhibited the formation of the smaller R2 fragment (arrow). C, synchronized cells incubated in culture medium (Ctrl) or treated with CHX or with TNF and CHX for 19 h were then placed in a medium containing CHX (10 μg/ml) and Q-VD-OPh (2 μm). After 0–24 h, cells were harvested, and time-dependent decay of proteins R2 and R1 was monitored by immunoblotting. D, relative amounts of protein R2 as shown in C and normalized to its expression at t = 0. Plots were fitted with a first-order exponential equation to estimate protein half-life. E, calculated half-life of R2 and R1 proteins in cells treated as described in C. A, B, and C, representative immunoblot (n ≥ 2). E, mean ± S.E. (error bars) of three experiments. **, p < 0.01.
FIGURE 10.
FIGURE 10.
Deoxynucleosides protect cells from apoptosis. A, HeLa 229 cells were cultured with TNF-α (10 ng/ml) and CHX (10 μg/ml) in the presence of the indicated concentrations of thymidine (dT), deoxycytidine (dC), deoxyadenosine (dA), and deoxyguanosine (dG). Apoptotic nuclei were counted after cell fixation and fluorescent labeling of DNA. Results are mean ± S.E. (error bars) of three experiments. **, p < 0.01. B, apoptosis was determined by a fluorometric TUNEL assay. Cells were either left untreated (thin line) or treated with TNF and CHX in the absence (thick line) or presence of dT/dC, each at 40 μm, and dA/dG at 150 μm (gray shaded area). Fixed cells were submitted to the terminal deoxynucleotidyltransferase reaction, and fluorescent nuclear labeling was analyzed by flow cytometry.

Similar articles

Cited by

References

    1. Nordlund P., Reichard P. (2006) Ribonucleotide reductases. Annu. Rev. Biochem. 75, 681–706 - PubMed
    1. Niida H., Shimada M., Murakami H., Nakanishi M. (2010) Mechanisms of dNTP supply that play an essential role in maintaining genome integrity in eukaryotic cells. Cancer Sci. 101, 2505–2509 - PMC - PubMed
    1. Chabes A. L., Pfleger C. M., Kirschner M. W., Thelander L. (2003) Mouse ribonucleotide reductase R2 protein: a new target for anaphase-promoting complex-Cdh1-mediated proteolysis. Proc. Natl. Acad. Sci. U.S.A. 100, 3925–3929 - PMC - PubMed
    1. D'Angiolella V., Donato V., Forrester F. M., Jeong Y. T., Pellacani C., Kudo Y., Saraf A., Florens L., Washburn M. P., Pagano M. (2012) Cyclin F-mediated degradation of ribonucleotide reductase M2 controls genome integrity and DNA repair. Cell 149, 1023–1034 - PMC - PubMed
    1. Pontarin G., Ferraro P., Håkansson P., Thelander L., Reichard P., Bianchi V. (2007) p53R2-dependent ribonucleotide reduction provides deoxyribonucleotides in quiescent human fibroblasts in the absence of induced DNA damage. J. Biol. Chem. 282, 16820–16828 - PubMed

Publication types