

Widespread vestibular activation of the rodent cortex
- PMID: 25878265
- PMCID: PMC4397593
- DOI: 10.1523/JNEUROSCI.1869-14.2015
Widespread vestibular activation of the rodent cortex
Abstract
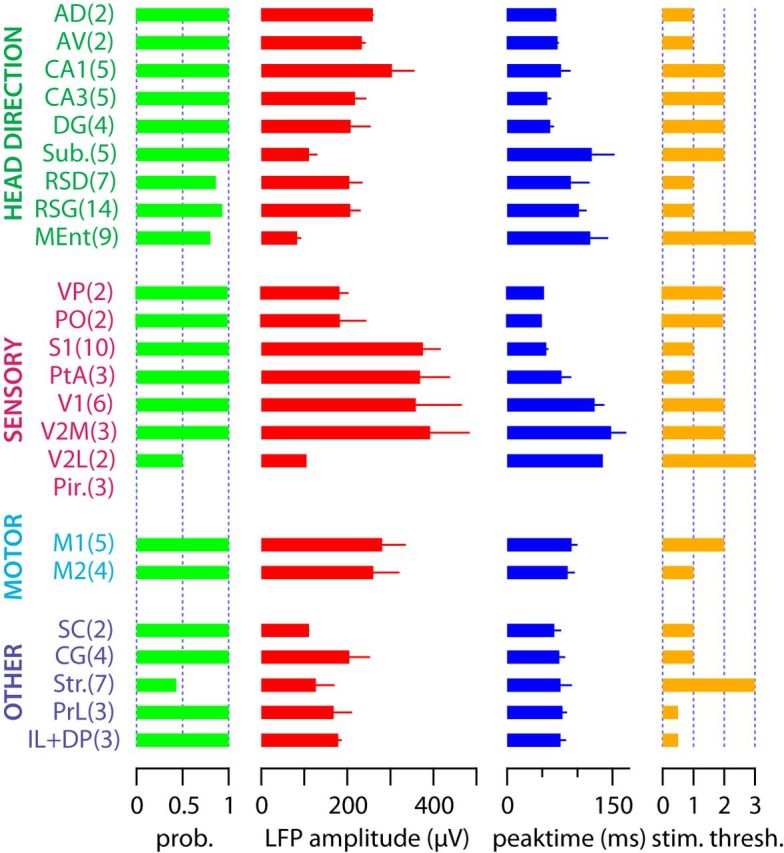
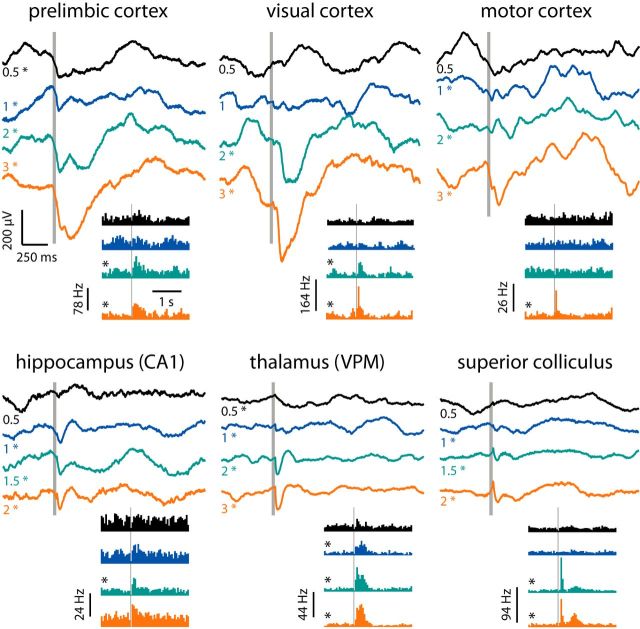
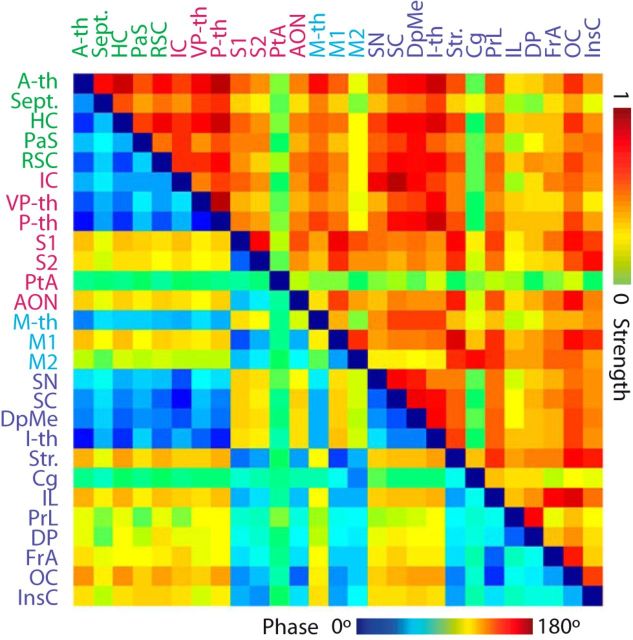
Much of our understanding of the neuronal mechanisms of spatial navigation is derived from chronic recordings in rodents in which head-direction, place, and grid cells have all been described. However, despite the proposed importance of self-reference information to these internal representations of space, their congruence with vestibular signaling remains unclear. Here we have undertaken brain-wide functional mapping using both fMRI and electrophysiological methods to directly determine the spatial extent, strength, and time course of vestibular signaling across the rat forebrain. We find distributed activity throughout thalamic, limbic, and particularly primary sensory cortical areas in addition to known head-direction pathways. We also observe activation of frontal regions, including infralimbic and cingulate cortices, indicating integration of vestibular information throughout functionally diverse cortical regions. These whole-brain activity maps therefore suggest a widespread contribution of vestibular signaling to a self-centered framework for multimodal sensorimotor integration in support of movement planning, execution, spatial navigation, and autonomic responses to gravito-inertial changes.
Keywords: evoked potential; fMRI; rat; self movement; spatial navigation; vestibular cortex.
Copyright © 2015 the authors 0270-6474/15/355926-09$15.00/0.
Figures
Similar articles
-
Macaque parieto-insular vestibular cortex: responses to self-motion and optic flow.J Neurosci. 2010 Feb 24;30(8):3022-42. doi: 10.1523/JNEUROSCI.4029-09.2010. J Neurosci. 2010. PMID: 20181599 Free PMC article.
-
Visual-vestibular processing in the human Sylvian fissure.J Neurophysiol. 2016 Aug 1;116(2):263-71. doi: 10.1152/jn.00009.2016. Epub 2016 Apr 13. J Neurophysiol. 2016. PMID: 27075535 Free PMC article.
-
Vestibular cortical area in the periarcuate cortex: its afferent and efferent projections.Ann N Y Acad Sci. 2005 Apr;1039:111-23. doi: 10.1196/annals.1325.011. Ann N Y Acad Sci. 2005. PMID: 15826966
-
Internal models of self-motion: computations that suppress vestibular reafference in early vestibular processing.Exp Brain Res. 2011 May;210(3-4):377-88. doi: 10.1007/s00221-011-2555-9. Epub 2011 Feb 1. Exp Brain Res. 2011. PMID: 21286693 Review.
-
Thalamocortical network: a core structure for integrative multimodal vestibular functions.Curr Opin Neurol. 2019 Feb;32(1):154-164. doi: 10.1097/WCO.0000000000000638. Curr Opin Neurol. 2019. PMID: 30461462 Review.
Cited by
-
ECoG activity distribution patterns detects global cortical responses following weak tactile inputs.iScience. 2024 Feb 28;27(4):109338. doi: 10.1016/j.isci.2024.109338. eCollection 2024 Apr 19. iScience. 2024. PMID: 38495818 Free PMC article.
-
Oxytocin Disturbs Vestibular Compensation and Modifies Behavioral Strategies in a Rodent Model of Acute Vestibulopathy.Int J Mol Sci. 2022 Dec 3;23(23):15262. doi: 10.3390/ijms232315262. Int J Mol Sci. 2022. PMID: 36499588 Free PMC article.
-
Repetitive Low-Intensity Vestibular Noise Stimulation Partly Reverses Behavioral and Brain Activity Changes following Bilateral Vestibular Loss in Rats.Biomolecules. 2023 Oct 26;13(11):1580. doi: 10.3390/biom13111580. Biomolecules. 2023. PMID: 38002261 Free PMC article.
-
Optogenetic fMRI interrogation of brain-wide central vestibular pathways.Proc Natl Acad Sci U S A. 2019 May 14;116(20):10122-10129. doi: 10.1073/pnas.1812453116. Epub 2019 Apr 26. Proc Natl Acad Sci U S A. 2019. PMID: 31028140 Free PMC article.
-
The role of GABAB receptors in the vestibular oculomotor system in mice.Behav Brain Res. 2016 Apr 1;302:152-9. doi: 10.1016/j.bbr.2016.01.017. Epub 2016 Jan 8. Behav Brain Res. 2016. PMID: 26778789 Free PMC article.
References
Publication types
MeSH terms
Substances
Grants and funding
LinkOut - more resources
Full Text Sources