. 2015 Apr 15;35(15):5935-40.
doi: 10.1523/JNEUROSCI.3876-14.2015.

Microsecond-scale timing precision in rodent trigeminal primary afferents

Affiliations

Microsecond-scale timing precision in rodent trigeminal primary afferents

Michael R Bale et al. J Neurosci. .

Abstract

Communication in the nervous system occurs by spikes: the timing precision with which spikes are fired is a fundamental limit on neural information processing. In sensory systems, spike-timing precision is constrained by first-order neurons. We found that spike-timing precision of trigeminal primary afferents in rats and mice is limited both by stimulus speed and by electrophysiological sampling rate. High-speed video of behaving mice revealed whisker velocities of at least 17,000°/s, so we delivered an ultrafast "ping" (>50,000°/s) to single whiskers and sampled primary afferent activity at 500 kHz. Median spike jitter was 17.4 μs; 29% of neurons had spike jitter < 10 μs. These results indicate that the input stage of the trigeminal pathway has extraordinary spike-timing precision and very high potential information capacity. This timing precision ranks among the highest in biology.

Keywords: neural coding; trigeminal ganglion; vibrissa; whisker.


Figures

Figure 1.
Figure 1.
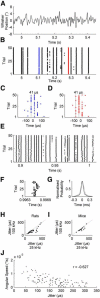
Effect of sampling rate and stimulus velocity/position on spike-timing jitter. A, Excerpt of white noise stimulus. B, Spike time raster plot, from a rat trigeminal primary afferent unit sampled at 24.4 kHz, evoked by white noise whisker stimulation. C, D, Expanded view of timing of two firing events (red and blue in B), showing discretization of spike times due to the sampling interval (41 μs). E, Raster plot, for an example rat unit, evoked by white noise stimulation, sampled at 100 kHz. F, Expanded view of E for one firing event, showing spike times sampled at 100 kHz (black small dots) and downsampled to 25 kHz (gray big dots). G, Pooled peak PSTH for the example unit in E recorded at 100 kHz (black) and downsampled to 25 kHz (gray). H, I, Scatter plots of spike-timing jitter for rat and mouse units, respectively, recorded at 100 kHz sampling rate (black), compared with that of the same data downsampled to 25 kHz. J, Scatter plot of whisker speed versus jitter for an example mouse unit.
Figure 2.
Figure 2.
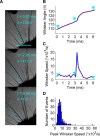
Velocity of whisker motion during stick-slip events. A, Whisker motion recorded by high-speed video (4800 fps) while a mouse explored a pole before (top), during (middle), and after (bottom) a slip event, with whisker tracker solutions for one whisker overlaid (cyan dots). B, Time course of whisker angle for the slip event illustrated in A (cyan arrowheads correspond to the frames of A). C, Time course of whisker speed for the slip event in A. D, Histogram of peak whisker angular speed in each measured slip event.
Figure 3.
Figure 3.
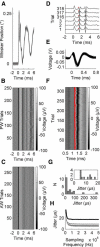
Microsecond spike-timing precision. A, Motion of the piezoelectric actuator in response to a voltage step (“ping stimulus”), measured optically: 1000 repetitions overlaid (gray) with the mean (black). B, Extracellular potentials evoked by 250 repetitions of the ping stimulus, applied to the principal whisker (PW; in this case, D2) of a typical mouse unit. The stimulus generates a transient artifact (t = 0 ms), clearly differentiated from the unit-spiking response, starting at t = 1 ms. C, Response of the same unit as in B to the ping stimulus delivered to an adjacent whisker (AW; E2). Since primary whisker afferents respond only to deflection of a single whisker, this isolates the stimulus artifact from neural activity. D, Extracellular potential recorded at 500 kHz sampling rate for a different example mouse unit, following ping stimulus at time 0. The first spike post-stimulus onset on each trial is highlighted by a red dot. E, Extracted spike waveforms for the unit in D. F, Extracellular potential recorded at 500 kHz sampling rate for all trials of the mouse unit in D. First spike post-stimulus onset on each trial highlighted by a red dot. G, Histogram of spike-time jitter for all 500 kHz single units. Inset shows expanded view for range 0–20 μs. H, Jitter as a function of (downsampled) sampling rate for the six units with lowest jitter (gray) and the median of all units (black).

References

    1. Adrian ED. The impulses produced by sensory nerve endings: Part I. J Physiol. 1926;61:49–72. doi: 10.1113/jphysiol.1926.sp002273. - DOI - PMC - PubMed
    1. Ahissar E, Knutsen PM. Object localization with whiskers. Biol Cybern. 2008;98:449–458. doi: 10.1007/s00422-008-0214-4. - DOI - PubMed
    1. Arabzadeh E, Zorzin E, Diamond ME. Neuronal encoding of texture in the whisker sensory pathway. PLoS Biol. 2005;3:e17. doi: 10.1371/journal.pbio.0030017. - DOI - PMC - PubMed
    1. Arabzadeh E, Panzeri S, Diamond ME. Deciphering the spike train of a sensory neuron: counts and temporal patterns in the rat whisker pathway. J Neurosci. 2006;26:9216–9226. doi: 10.1523/JNEUROSCI.1491-06.2006. - DOI - PMC - PubMed
    1. Bale MR, Petersen RS. Transformation in the neural code for whisker deflection direction along the lemniscal pathway. J Neurophysiol. 2009;102:2771–2780. doi: 10.1152/jn.00636.2009. - DOI - PMC - PubMed

Publication types

LinkOut - more resources