. 2015 Apr 15;35(15):6117-30.
doi: 10.1523/JNEUROSCI.4145-14.2015.

Origin of thoracic spinal network activity during locomotor-like activity in the neonatal rat

Affiliations

Origin of thoracic spinal network activity during locomotor-like activity in the neonatal rat

Lauriane Beliez et al. J Neurosci. .

Abstract

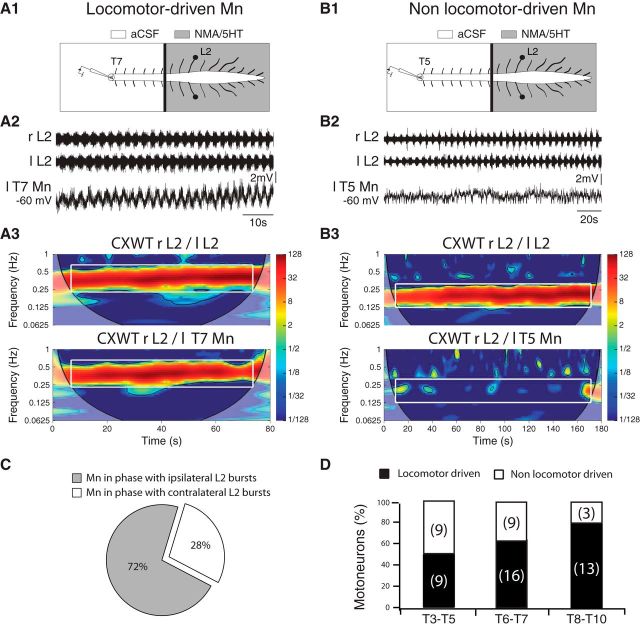
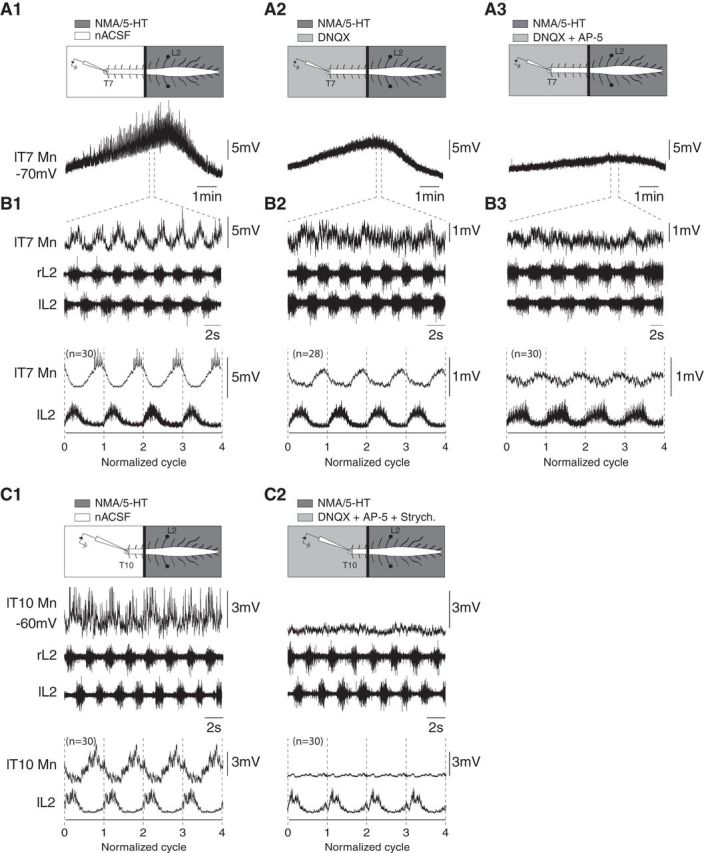
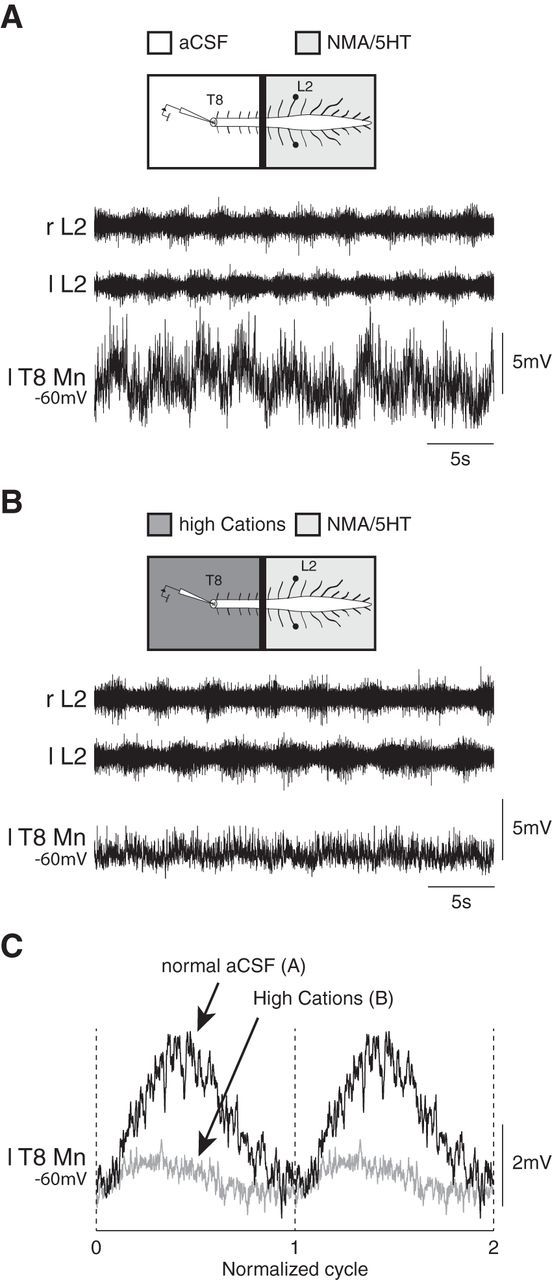
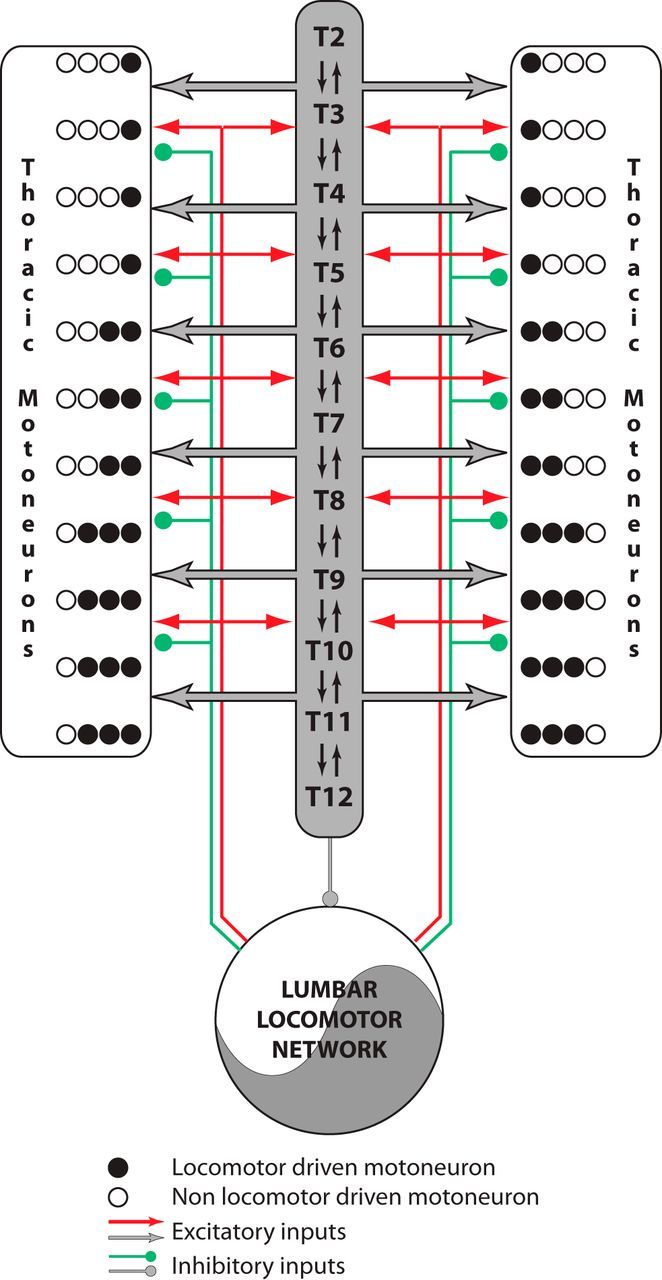
Effective quadrupedal locomotor behaviors require the coordination of many muscles in the limbs, back, neck, and tail. Because of the spinal motoneuronal somatotopic organization, motor coordination implies interactions among distant spinal networks. Here, we investigated some of the interactions between the lumbar locomotor networks that control limb movements and the thoracic networks that control the axial muscles involved in trunk movement. For this purpose, we used an in vitro isolated newborn rat spinal cord (from T2 to sacrococcygeal) preparation. Using extracellular ventral root recordings, we showed that, while the thoracic cord possesses an intrinsic rhythmogenic capacity, the lumbar circuits, if they are rhythmically active, will entrain the rhythmicity of the thoracic circuitry. However, if the lumbar circuits are rhythmically active, these latter circuits will entrain the rhythmicity of the thoracic circuitry. Blocking the synaptic transmission in some thoracic areas revealed that the lumbar locomotor network could trigger locomotor bursting in distant thoracic segments through short and long propriospinal pathways. Patch-clamp recordings revealed that 72% of the thoracic motoneurons (locomotor-driven motoneurons) expressed membrane potential oscillations and spiking activity coordinated with the locomotor activity expressed by the lumbar cord. A biphasic excitatory (glutamatergic)/inhibitory (glycinergic) synaptic drive was recorded in thoracic locomotor-driven motoneurons. Finally, we found evidence that part of this locomotor drive involved a monosynaptic component coming directly from the lumbar locomotor network. We conclude that the lumbar locomotor network plays a central role in the generation of locomotor outputs in the thoracic cord by acting at both the premotoneuronal and motoneuronal levels.

Keywords: axial; coordination; in vitro; locomotion; posture; spinal cord.


Figures

Figure 1.
Figure 1.
Thoracolumbar bursting coordination during fictive locomotion. A, Schematic diagram of the experimental procedure (left). Simultaneous recordings from lumbar and thoracic ventral roots during an episode of locomotor-like activity induced by NMA (15 μm) and 5-HT (15 μm; right). B, High-pass filtered, rectified, and smoothed traces (left) taken from the sequence presented in A (gray area). The right panel illustrates the mean normalized cycle repeated two times (n = 63 cycles, right L2 taken as reference). C, Example of the wavelet analysis performed between pairs of recordings. Cross wavelet transform (top) and wavelet coherence between bilateral L2 activities revealed the common high-power frequencies and correlation between signals over time, respectively. The power and coherence of the frequencies between traces are color coded with warm and cool colors to indicate high and low values, respectively. Black contours delimit areas within the 5% significance level. Regions of interest (white dashed rectangles) were defined from the map obtained by mixing the results of the cross-wavelet and wavelet coherence (bottom map). White arrows indicate the phase relationship between each significant frequency components (the left direction indicates an out-of-phase relationship). The bottom graphs illustrate the evolution of the frequency (black markers) and coherence (red markers) over time within the regions of interest. Each marker represents the mean values obtained using bins of 1 s. D, Polar plot representations of the phase relationships between the bursting activities recorded from various ventral roots and the right L2. The direction and length of the red arrows indicate the mean phase value and the r value, respectively. The distributions of raw values are also provided as histograms (using bins of 5°). r, Right; l, left; T, thoracic; L, lumbar.
Figure 2.
Figure 2.
Conditional rhythmogenic capabilities of thoracic spinal segments. A, Raw or integrated (formula image
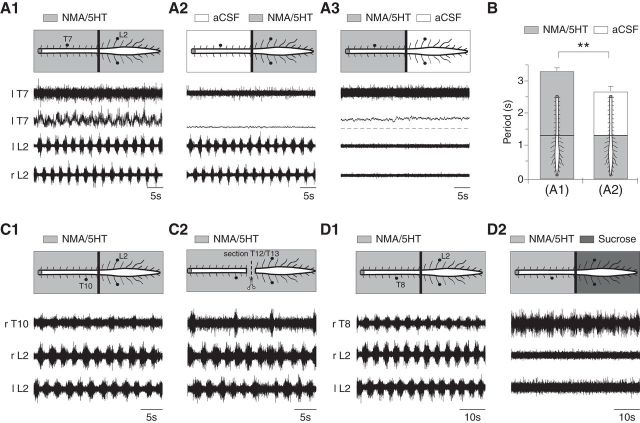
) extracellular activities were recorded in whole spinal cords (A1) or lumbar (A2) or thoracic (A3) segments treated with NMA (15 μm) and 5-HT (15 μm), coordinating with the rhythmic motor bursts recorded from the left thoracic T7 and left and right lumbar L2 ventral roots. B, Plot of the locomotor period as a function of the experimental condition (NMA/5-HT applied to the whole preparation or to the lumbar part, n = 28 preparations). C, D, Extracellular activities recorded from T10 or T8 and bilateral L2 ventral roots during the application of NMA/5-HT to the whole spinal cord under control conditions (C1, D1), after T12/T13 sectioning (C2) or in the presence of a sucrose block on the lumbar segments (D2). r, Right; l, left; T, thoracic; L, lumbar.
Figure 3.
Figure 3.
Evidence of long ascending pathways between lumbar and thoracic networks. A, Coordinated locomotor-like activities recorded at different thoracolumbar levels triggered by bath application of NMA/5-HT to the whole spinal cord preparation. B, Effects of the synaptic transmission blockade on the NMA/5-HT-induced locomotor activity in T6–T12 segments treated with an aCSF solution containing low Ca2+/high Mg2+. Note the absence of bursting activity on T9. C, Polar plots of the phase relationships between T3 (bottom) or T5 (top) and right L2 locomotor bursts were taken as reference before (control, left) and after synaptic transmission blockade in the midthoracic segments (low Ca2+/high Mg2+, right). Note the clockwise shift of the mean phase observed at both thoracic levels in the presence of the low-Ca2+/high-Mg2+ solution. r, Right; l, left; T, thoracic; L, lumbar.
Figure 4.
Figure 4.
Localization and intracellular characterization of thoracic motoneurons. A, Localization of motoneurons innervating the axial back muscles in the T12 segment. A1, Photomicrographs of ChAT immunoreactivity in T12 showing the ventromedial and lateral motoneuronal populations in lamina IX. The upper left inset shows details at higher magnification. A2, Motoneurons were retrogradely labeled with a cholera toxin-B subunit Alexa Fluor 488 conjugate (CTB) injected into the back muscles. A3, The merge panel shows that the motoneurons of the back muscles are located in the ventral part of the ventromedial motoneuronal population. The arrows in A2 and A3 point to double-labeled motoneurons. B, Schematic of the experimental procedure (left). The spinal cord was transected at a given thoracic segment and placed on a Sylgard support to allow access to the motoneurons with intracellular electrodes. Motoneurons were identified by the presence of an antidromic action potential recorded in response to stimulations of the corresponding ventral root (right). C, Diagrams of the experimental procedure (left). Extracellular recordings of the left and right L2 ventral roots during an episode of NMA/5-HT-induced fictive locomotion together with the intracellular recording of a T9 motoneuron that rhythmically emitted a burst of action potentials in phase with the locomotor cycle (a locomotor driven motoneuron). Bar histograms in the right panel represents the number of spikes emitted during the locomotor cycle (normalized and averaged from the left L2 bursting activity and arbitrarily split into 10 subphases, top trace). The thick black line in the graph indicates for each locomotor cycle subphase the percentage of cycles (right ordinate) during which the motoneurons fired action potentials. D, Same as C but for a T5 motoneuron that exhibited action potentials independent from the locomotor activity (a nonlocomotor-driven motoneuron). r, Right; l, left; T, thoracic; L, lumbar; Stim VR, ventral root stimulation.
Figure 5.
Figure 5.
Restricted pharmacological activation of lumbar locomotor networks triggers membrane potential oscillations in thoracic locomotor-driven motoneurons. A1, B1, Schematic of the experimental procedure. A Vaseline wall was built at the T12 level so that the lumbar segments could be activated separately from the thoracic cord. Extracellular recordings were performed from the left and right L2 ventral roots and intracellular recordings from motoneurons were performed at different thoracic levels. The NMA/5-HT mixture was applied to the lumbar cord to induce fictive locomotion. Shown is the activity of an intracellularly recorded motoneuron that exhibited locomotor-timed membrane potential oscillations in this experimental condition (A2, locomotor-driven motoneurons) and of another motoneuron that did not exhibit locomotor-timed membrane potential oscillations in this experimental condition (B2, nonlocomotor-driven motoneurons). Mn, Motoneurons. A3, Mixed cross-coherence maps (CXWT) highlighting the correlation between the activity recorded from L2 ventral roots (top) and between the motoneuron membrane potential oscillations and the right L2 ventral root (bottom). B3, Same representation as in A3. Note that in this case the motoneuron membrane potential fluctuations are not correlated to the lumbar activity. C, The percentage of locomotor-driven motoneurons showing a synaptic drive in phase with the ipsilateral (gray) or contralateral (white) L2 locomotor bursts. D, Cumulative histograms of the percentages of locomotor-driven (black) and nonlocomotor-driven motoneurons in the upper (T3–T5), intermediate (T6–T7), and lower (T8–T10) thoracic segments. Numbers in brackets indicate the number of motoneurons. r, Right; l, left; T, thoracic; L, lumbar.
Figure 6.
Figure 6.
Characterization of the synaptic drive received by locomotor-driven thoracic motoneurons. A, Time courses of the overall membrane potential depolarization recorded from a T7 motoneuron from the onset to the end of a locomotor episode induced by restricted applications of NMA/5-HT compared with the lumbar cord under control conditions (A1), and during thoracic bath application of DNQX (5 μm) alone (A2) or combined with AP5 (5 μm; A3). Note the decreased amplitude of the slow depolarization in the presence of DNQX and DNQX/AP5. B, Sequences of locomotor-like activity extracted from the episodes presented in A, which show that the membrane potential oscillations are phase-locked to the locomotor activity. The bottom panels illustrate the mean cycle (repeated 4 times) obtained using the left L2 at the thoracic level under control conditions as the reference, or in the presence of DNQX or DNQX/AP5. C, Representative traces of a thoracic motoneuron (T10) recorded during NMA/5-HT-induced locomotion under control conditions (C1) and in the presence of strychnine (2 μm), DNQX (5 μm), and AP5 (5 μm; C2) applied to the thoracic segments. r, Right; l, left; T, thoracic; L, lumbar.
Figure 7.
Figure 7.
Monosynaptic contribution of the lumbar locomotor network to the synaptic driving of thoracic motoneurons. A, Membrane potential oscillations recorded from a T8 motoneuron during NMA/5-HT-induced locomotor-like activity in the lumbar spinal cord. B, Decreases in amplitude of the locomotor synaptic drive is still observed in the same motoneuron when a solution containing a high concentration of cations is applied to the thoracic segment to depress the polysynaptic pathways. C, The mean synaptic drive computed from the recordings is presented in A and B in normal aCSF (black trace) and in high-cation-containing aCSF (gray trace). r, Right; l, left; T, thoracic; L, lumbar.
Figure 8.
Figure 8.
Schematic diagram summarizing the relationships between the lumbar locomotor network and the thoracic circuitry. The lumbar locomotor network drives thoracic activity while acting at both the premotoneuronal (dark gray) and motoneuronal levels through short and long propriospinal pathways. The descending arrow indicates that the thoracic networks can modulate the period of the activity generated by the lumbar locomotor network.

References

    1. Ampatzis K, Song J, Ausborn J, El Manira A. Pattern of innervation and recruitment of different classes of motoneurons in adult zebrafish. J Neurosci. 2013;33:10875–10886. doi: 10.1523/JNEUROSCI.0896-13.2013. - DOI - PMC - PubMed
    1. Ausborn J, Mahmood R, El Manira A. Decoding the rules of recruitment of excitatory interneurons in the adult zebrafish locomotor network. Proc Natl Acad Sci U S A. 2012;109:E3631–E3639. doi: 10.1073/pnas.1216256110. - DOI - PMC - PubMed
    1. Ballion B, Morin D, Viala D. Forelimb locomotor generators and quadrupedal locomotion in the neonatal rat. Eur J Neurosci. 2001;14:1727–1738. doi: 10.1046/j.0953-816x.2001.01794.x. - DOI - PubMed
    1. Beliez L, Barrière G, Bertrand SS, Cazalets JR. Multiple monoaminergic modulation of posturo-locomotor network activity in the newborn rat spinal cord. Front Neural Circuits. 2014;8:99. doi: 10.3389/fncir.2014.00099. - DOI - PMC - PubMed
    1. Berens P. CircStat: a Matlab toolbox for circular statistics. J Statistical Software. 2009;31:1–21.

Publication types

MeSH terms

LinkOut - more resources