. 2015 Apr 15;35(15):6231-40.
doi: 10.1523/JNEUROSCI.4137-14.2015.

Modulations in oscillatory frequency and coupling in globus pallidus with increasing parkinsonian severity

Affiliations

Modulations in oscillatory frequency and coupling in globus pallidus with increasing parkinsonian severity

Allison T Connolly et al. J Neurosci. .

Abstract

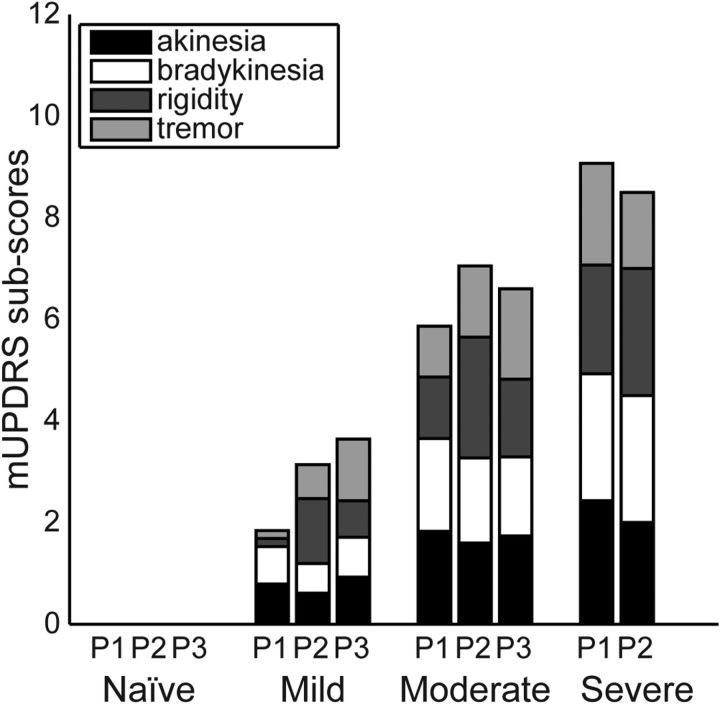
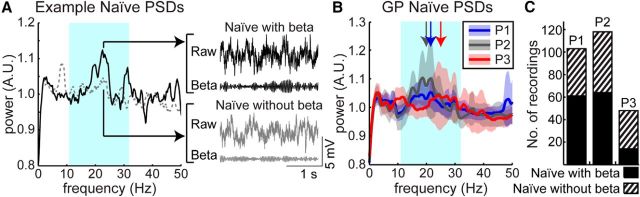
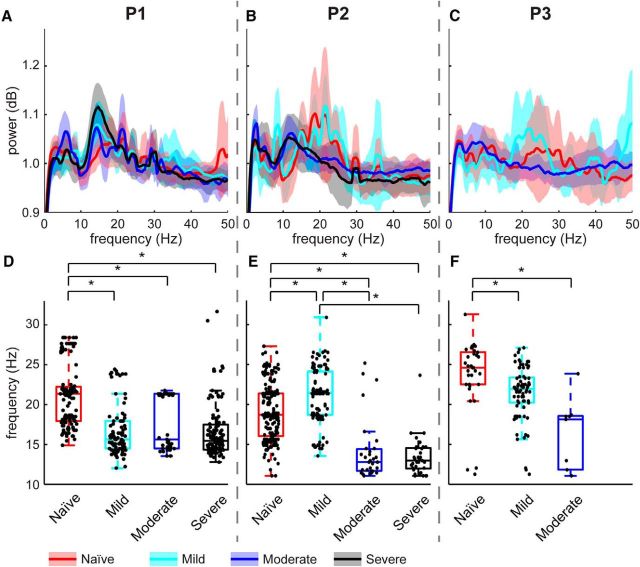
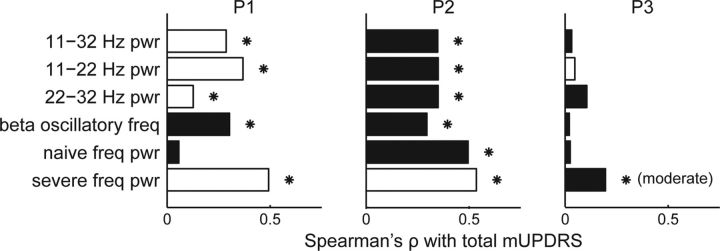
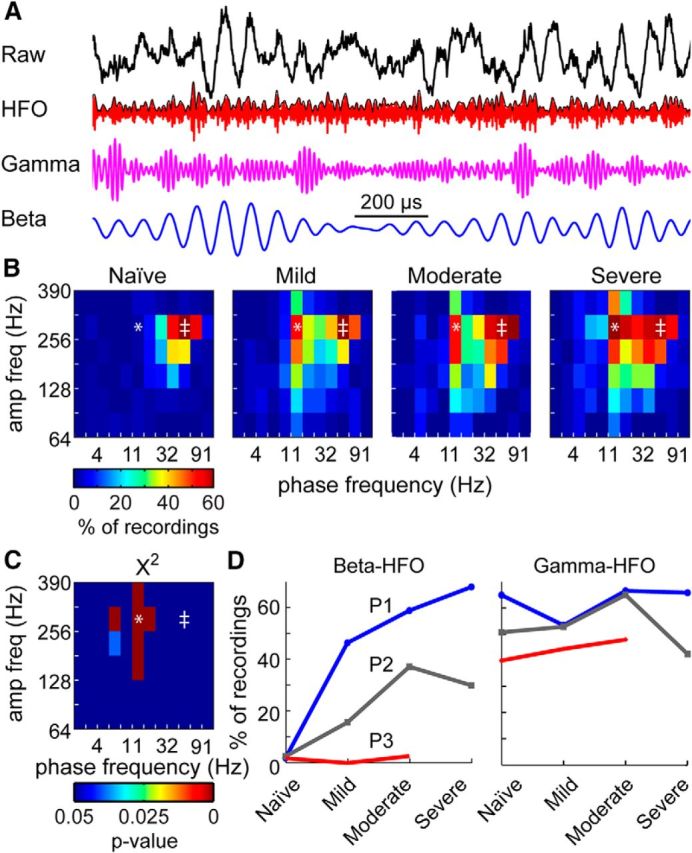
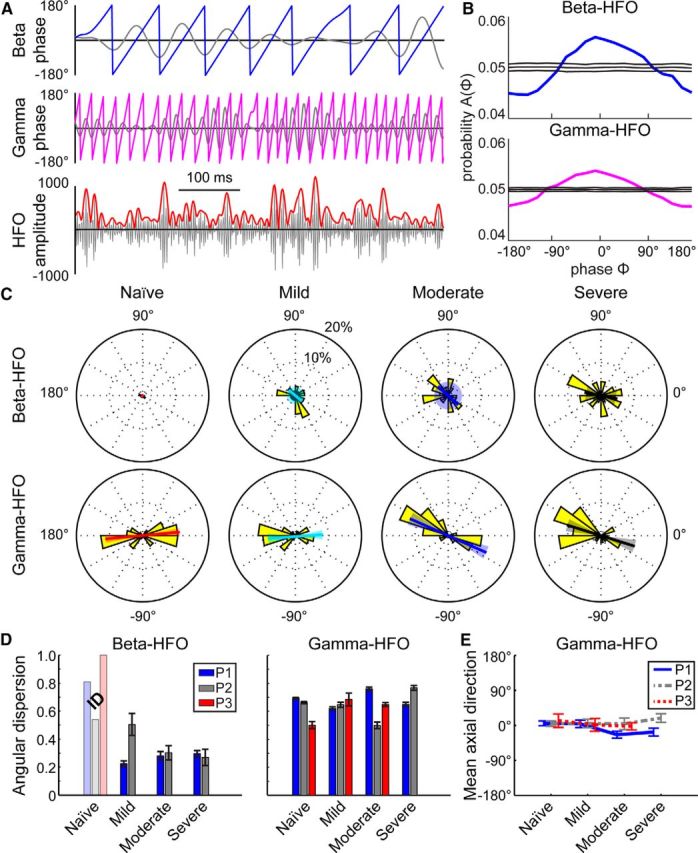
While beta oscillations often occur within the parkinsonian basal ganglia, how these oscillations emerge from a naive state and change with disease severity is not clear. To address this question, a progressive, nonhuman primate model of Parkinson's disease was developed using staged injections of MPTP. Within each parkinsonian state (naive, mild, moderate, and severe), spontaneous local field potentials were recorded throughout the sensorimotor globus pallidus. In the naive state, beta oscillations (11-32 Hz) occurred in half of the recordings, indicating spontaneous beta oscillations in globus pallidus are not pathognomonic. Mild and moderate states were characterized by a narrower distribution of beta frequencies that shifted toward the 8-15 Hz range. Additionally, coupling between the phase of beta and the amplitude of high-frequency oscillations (256-362 Hz) emerged in the mild state and increased with severity. These findings provide a novel mechanistic framework to understand how progressive loss of dopamine translates into abnormal information processing in the pallidum through alterations in oscillatory activity. The results suggest that rather than the emergence of oscillatory activity in one frequency spectrum or the other, parkinsonian motor signs may relate more to the development of altered coupling across multiple frequency spectrums.

Keywords: Parkinson's disease; globus pallidus; local field potential; oscillations; phase-amplitude coupling.


Figures

Figure 1.
Figure 1.
Progression of mUPDRS subscores for the cardinal parkinsonian motor signs in the three subjects (subjects P1, P2, and P3). Each subscore was rated on a scale of 0–3, averaged over the contralateral arm and leg, and averaged over all days in the severity state (naive, mild, moderate, and severe).
Figure 2.
Figure 2.
Beta oscillations in the naive state. A, Example power spectra and time series data from the naive state identified with (solid black) and without (dashed gray) significant beta oscillatory activity. B, Averaged power spectra across all recordings for each subject in the naive state. Bold lines show means and shaded areas show ± 1 SD of flattened power spectra for subjects P1 (blue), P2 (gray), and P3 (red) in the GP in the naive state. Arrows demarcate median frequencies of beta oscillations for each subject. The cyan shaded area corresponds to the beta band. C, Number of recordings with (solid) and without (hashed) detected beta peaks for each subject.
Figure 3.
Figure 3.
Evolution of beta oscillatory activity with increasing disease severity. A–C, Flattened PSDs of all recordings for subjects P1, P2, and P3. Bold traces signify means and shaded areas show ± 1 SD. Red is naive, cyan is mild, blue is moderate, and black is severe. D–F, Peak beta frequencies recorded across all parkinsonian states. Dots represent frequencies in the beta range with peaks that exceeded the significance threshold. Dots are randomly distributed horizontally within each severity level for better visualization. Asterisks indicate significant differences, tested with Dunn's post hoc comparisons, and an adjusted significance level of α = 8.333e-3.
Figure 4.
Figure 4.
Correlation between LFP features and total mUPDRS. Bars indicate the magnitude of Spearman's ρ correlation between specific beta features and total mUPDRS scores over all disease states grouped by individual subject (P1, P2, and P3). Features include the power (pwr) in the overall, low, and high beta bands; the frequency of beta oscillations (only for recordings with a significant beta oscillation); the power at the median frequency of beta oscillations over all naive recordings; and the power at the median frequency of beta oscillations over all severe recordings. White bars indicate positive correlations, black bars indicate negative correlations, and asterisks indicate significant correlations (Spearman's ρ, α = 0.05).
Figure 5.
Figure 5.
Progression of pallidal phase-amplitude coupling with parkinsonian severity. A, Example LFP time series with wide-band (0.1–390 Hz), HFO-band (256–362 Hz), gamma-band (45–64 Hz), and beta-band (11–16 Hz) filtering. B, Percentage of recordings with a significant z-score for each parkinsonian state in subject P1. C, χ2 results showing significant changes in the occurrence of coupling for each phase-amplitude pair in P1. D, Relationship between HFO amplitude and beta (*) or gamma (‡) phases. All statistics used a significance level of α < 0.05 with a Bonferroni correction.
Figure 6.
Figure 6.
Differences in the locking of HFO amplitude to phases of beta and gamma oscillations for subject P1. A, Examples of beta (11–16 Hz, blue) and gamma (45–64 Hz, magenta) phase signals with simultaneous HFO (256–362 Hz, red) amplitude signal from an LFP in the severe state. Bandpass filtered data are shown in gray. B, Coupling was measured by comparing the phase-amplitude distribution (bold line) with a distribution of time-shuffled surrogates (mean ± 2 SD, shown with thin lines) for beta-HFO (top, blue) and gamma-HFO (magenta, bottom) pairs. C, In subject P1, radial histograms of the phase at which the phase-amplitude distribution in B was peaked for recordings with significant PACz-scores (yellow). Beta was defined as 11–16 Hz, gamma as 45–64 Hz, and HFO as 256–362 Hz for all recordings. The bold colored line shows the mean axial direction with the shaded area representing the 95% confidence interval. For beta-HFO mild and moderate states, there was no significant axial direction as tested by the Omnibus test, so the 95% confidence interval encompasses the entire circle. D, Angular dispersion (0 represents dispersed angles, 1 represents aligned angles) and jackknife error bars of the radial distributions shown in C for all subjects and all parkinsonian states (P1, blue; P2, gray; P3, red). For all subjects, there were not enough recordings (N < 6, insufficient data, marked ID) with a significant beta-HFO modulation index to perform the dispersion analysis in the naive state (and in the mild and moderate states in P3; faded bars). E, Mean axial direction with 95% confidence interval for all subjects and parkinsonian states for gamma-HFO coupling. Beta-HFO coupling is not shown because the distributions were not different from uniform, as tested by the Omnibus test.

Similar articles

Cited by

References

    1. Alavi M, Dostrovsky JO, Hodaie M, Lozano AM, Hutchison WD. Spatial extent of beta oscillatory activity in and between the subthalamic nucleus and substantia nigra pars reticulata of Parkinson's disease patients. Exp Neurol. 2013;245:60–71. doi: 10.1016/j.expneurol.2012.09.021. - DOI - PubMed
    1. Bergman H, Wichmann T, Karmon B, DeLong MR. The primate subthalamic nucleus. II. Neuronal activity in the MPTP model of parkinsonism. J Neurophysiol. 1994;72:507–520. - PubMed
    1. Bergman H, Raz A, Feingold A, Nini A, Nelken I, Hansel D, Ben-Pazi H, Reches A. Physiology of MPTP tremor. Mov Disord. 1998;13(Suppl 3):29–34. - PubMed
    1. Berke JD, Okatan M, Skurski J, Eichenbaum HB. Oscillatory entrainment of striatal neurons in freely moving rats. Neuron. 2004;43:883–896. doi: 10.1016/j.neuron.2004.08.035. - DOI - PubMed
    1. Bokil H, Andrews P, Kulkarni JE, Mehta S, Mitra PP. Chronux: a platform for analyzing neural signals. J Neurosci Methods. 2010;192:146–151. doi: 10.1016/j.jneumeth.2010.06.020. - DOI - PMC - PubMed

Publication types

LinkOut - more resources