

Potential demand for respirators and surgical masks during a hypothetical influenza pandemic in the United States
- PMID: 25878300
- PMCID: PMC7314226
- DOI: 10.1093/cid/civ141
Potential demand for respirators and surgical masks during a hypothetical influenza pandemic in the United States
Abstract
Background: To inform planning for an influenza pandemic, we estimated US demand for N95 filtering facepiece respirators (respirators) by healthcare and emergency services personnel and need for surgical masks by pandemic patients seeking care.
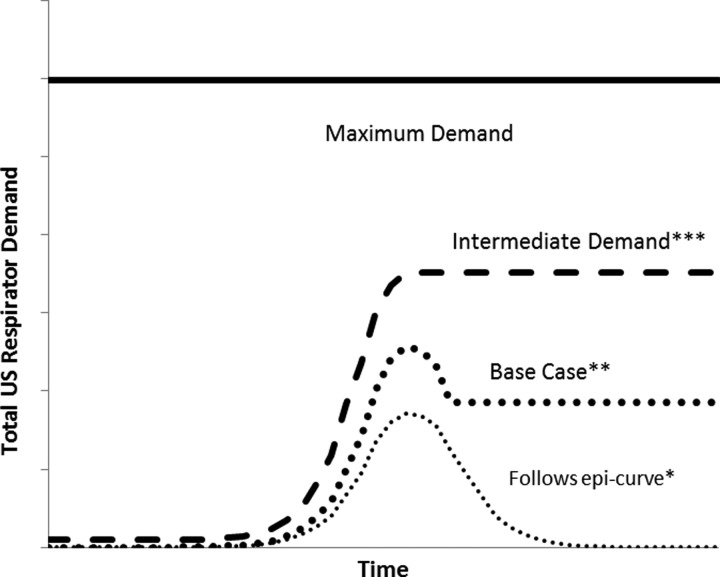
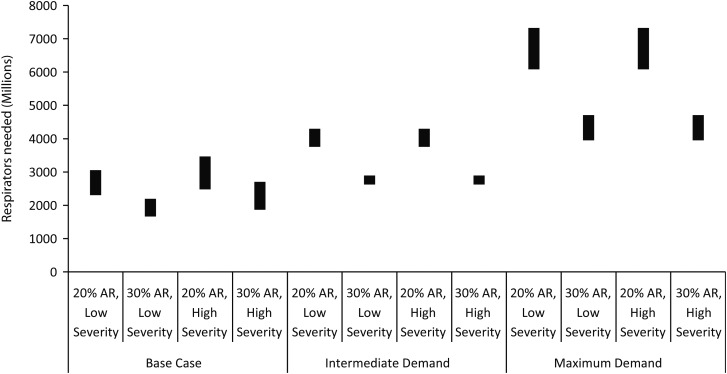
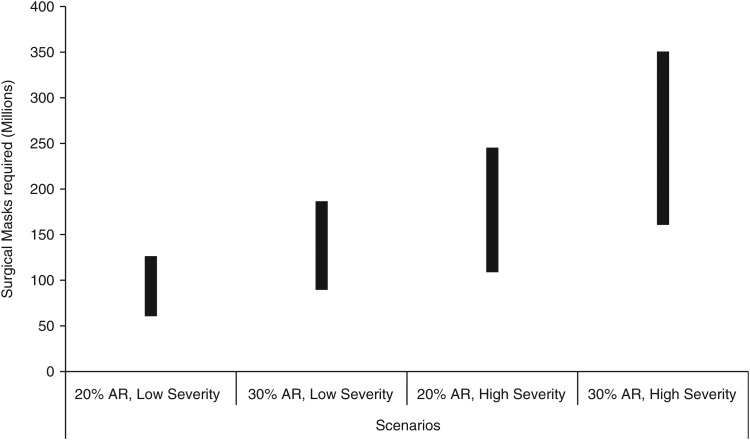
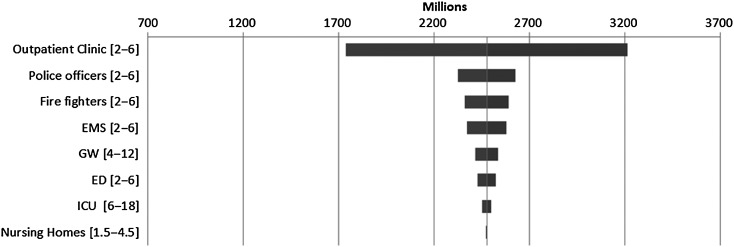
Methods: We used a spreadsheet-based model to estimate demand for 3 scenarios of respirator use: base case (usage approximately follows epidemic curve), intermediate demand (usage rises to epidemic peak and then remains constant), and maximum demand (all healthcare workers use respirators from pandemic onset). We assumed that in the base case scenario, up to 16 respirators would be required per day per intensive care unit patient and 8 per day per general ward patient. Outpatient healthcare workers and emergency services personnel would require 4 respirators per day. Patients would require 1.2 surgical masks per day.
Results and conclusions: Assuming that 20% to 30% of the population would become ill, 1.7 to 3.5 billion respirators would be needed in the base case scenario, 2.6 to 4.3 billion in the intermediate demand scenario, and up to 7.3 billion in the maximum demand scenario (for all scenarios, between 0.1 and 0.4 billion surgical masks would be required for patients). For pandemics with a lower attack rate and fewer cases (eg, 2009-like pandemic), the number of respirators needed would be higher because the pandemic would have longer duration. Providing these numbers of respirators and surgical masks represents a logistic challenge for US public health agencies. Public health officials must urgently consider alternative use strategies for respirators and surgical masks during a pandemic that may vary from current practices.
Keywords: influenza pandemic; respiratory protective devices.
Published by Oxford University Press on behalf of the Infectious Diseases Society of America 2015. This work is written by (a) US Government employee(s) and is in the public domain in the US.
Figures
Similar articles
-
Standardizing scenarios to assess the need to respond to an influenza pandemic.Clin Infect Dis. 2015 May 1;60 Suppl 1(Suppl 1):S1-8. doi: 10.1093/cid/civ088. Clin Infect Dis. 2015. PMID: 25878296 Free PMC article. Review. No abstract available.
-
Estimated N95 Respirator Needs for Nonhealthcare Essential Workers in the United States During Communicable Respiratory Infectious Disease Pandemics.Health Secur. 2022 Mar-Apr;20(2):127-136. doi: 10.1089/hs.2021.0166. Epub 2022 Feb 1. Health Secur. 2022. PMID: 35108104 Free PMC article.
-
Estimates of the demand for mechanical ventilation in the United States during an influenza pandemic.Clin Infect Dis. 2015 May 1;60 Suppl 1(Suppl 1):S52-7. doi: 10.1093/cid/civ089. Clin Infect Dis. 2015. PMID: 25878301 Free PMC article.
-
Facial protective equipment, personnel, and pandemics: impact of the pandemic (H1N1) 2009 virus on personnel and use of facial protective equipment.Infect Control Hosp Epidemiol. 2010 Oct;31(10):1011-6. doi: 10.1086/656564. Infect Control Hosp Epidemiol. 2010. PMID: 20731598
-
Effectiveness of N95 respirators versus surgical masks against influenza: A systematic review and meta-analysis.J Evid Based Med. 2020 May;13(2):93-101. doi: 10.1111/jebm.12381. Epub 2020 Mar 13. J Evid Based Med. 2020. PMID: 32167245 Free PMC article.
Cited by
-
Respirators in Healthcare: Material, Design, Regulatory, Environmental, and Economic Considerations for Clinical Efficacy.Glob Chall. 2022 Apr 12;6(10):2200001. doi: 10.1002/gch2.202200001. Online ahead of print. Glob Chall. 2022. PMID: 35601599 Free PMC article. Review.
-
Strategies for Optimizing the Supply of N95 Filtering Facepiece Respirators During the Coronavirus Disease 2019 (COVID-19) Pandemic.Disaster Med Public Health Prep. 2020 Oct;14(5):658-669. doi: 10.1017/dmp.2020.160. Epub 2020 May 19. Disaster Med Public Health Prep. 2020. PMID: 32423515 Free PMC article.
-
Principles and practice for SARS-CoV-2 decontamination of N95 masks with UV-C.Biophys J. 2021 Jul 20;120(14):2927-2942. doi: 10.1016/j.bpj.2021.02.039. Epub 2021 Mar 4. Biophys J. 2021. PMID: 33675766 Free PMC article. Review.
-
Carbon footprint assessment of face masks in the context of the COVID-19 pandemic: Based on different protective performance and applicable scenarios.J Clean Prod. 2023 Feb 10;387:135854. doi: 10.1016/j.jclepro.2023.135854. Epub 2023 Jan 2. J Clean Prod. 2023. PMID: 36619699 Free PMC article.
-
Mitigating the Transmission of COVID-19 with the Appropriate Usage of Personal Protective Protocols and Equipment in Breast Imaging and Intervention.J Breast Imaging. 2021 Jan 22;3(2):215-220. doi: 10.1093/jbi/wbab007. eCollection 2021 Mar-Apr. J Breast Imaging. 2021. PMID: 33778489 Free PMC article. Review.
References
-
- World Health Organization. Human infections with avian influenza A(H7N9) virus, 2014. Available at: http://www.who.int/influenza/human_animal_interface/influenza_h7n9/riska... Accessed 5 March 2015.
-
- National Institute for Occupational Safety and Health (NIOSH) CDC. Interim Guidance on Infection Control Measures for 2009 H1N1 Influenza in Healthcare Settings, Including Protection of Healthcare Personnel. Available at: http://www.cdc.gov/h1n1flu/guidelines_infection_control.htm Accessed 5 March 2015. - PubMed
-
- Krumkamp R, Kretzschmar M, Rudge JW, et al. Health service resource needs for pandemic influenza in developing countries: a linked transmission dynamics, interventions and resource demand model. Epidemiol Infect 2011; 139:59–67. - PubMed
MeSH terms
LinkOut - more resources
Full Text Sources
Other Literature Sources
Medical
