. 2015 Mar 23:5:9349.
doi: 10.1038/srep09349.

Titration of biologically active amyloid-β seeds in a transgenic mouse model of Alzheimer's disease

Affiliations

Titration of biologically active amyloid-β seeds in a transgenic mouse model of Alzheimer's disease

Rodrigo Morales et al. Sci Rep. .

Abstract

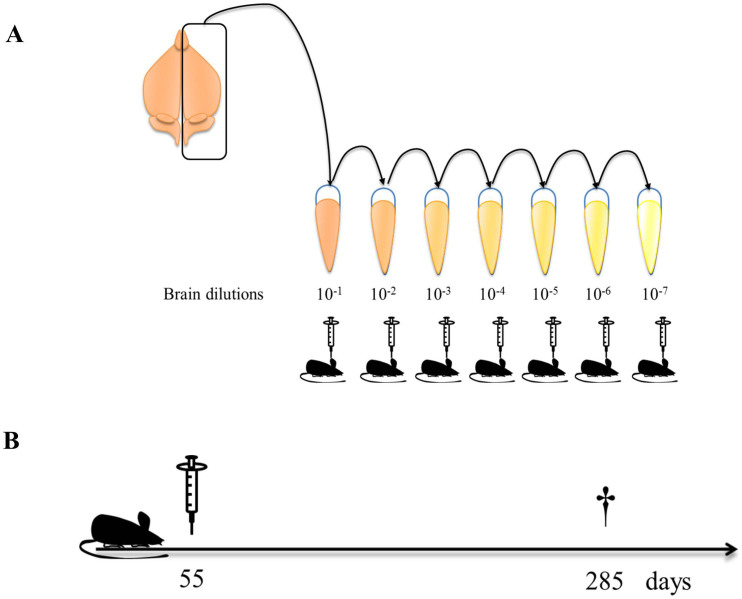
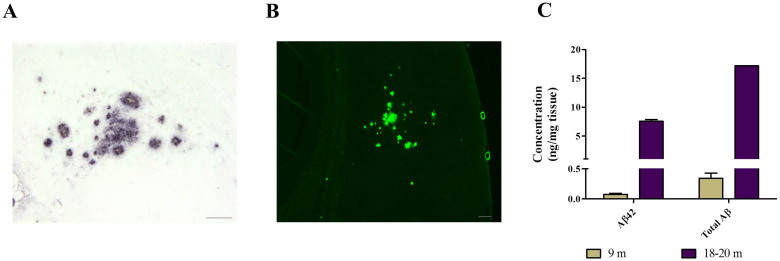
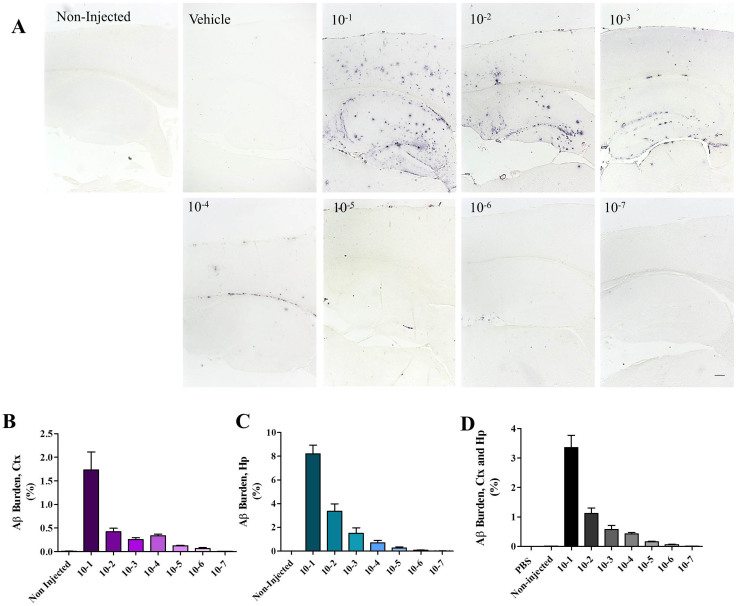
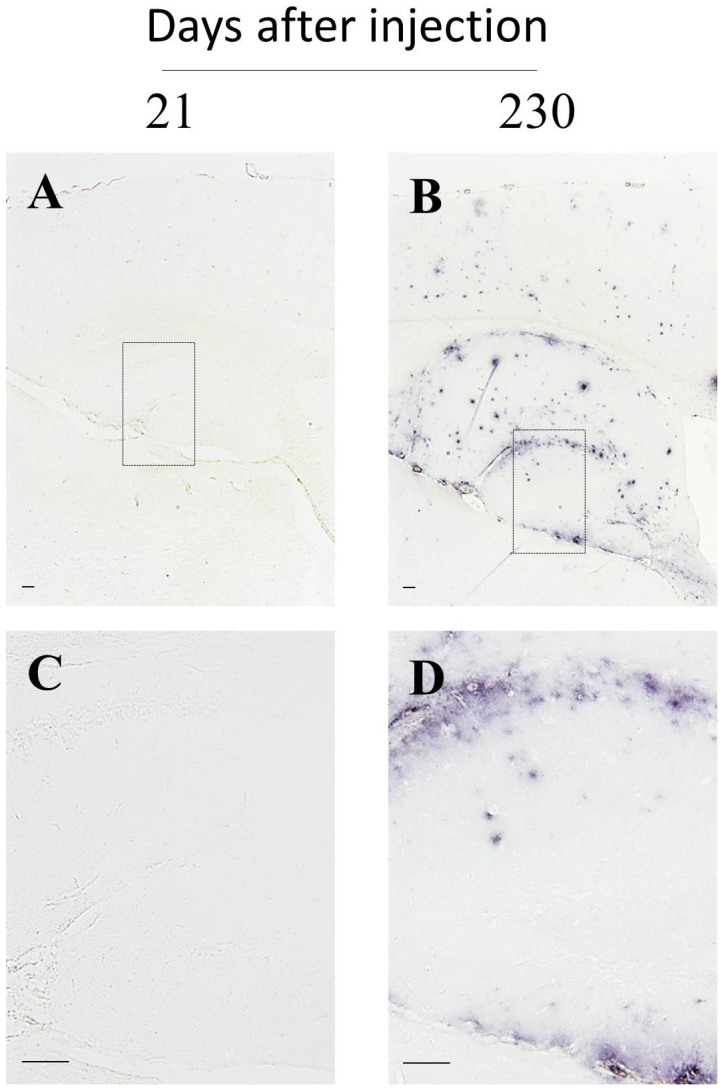
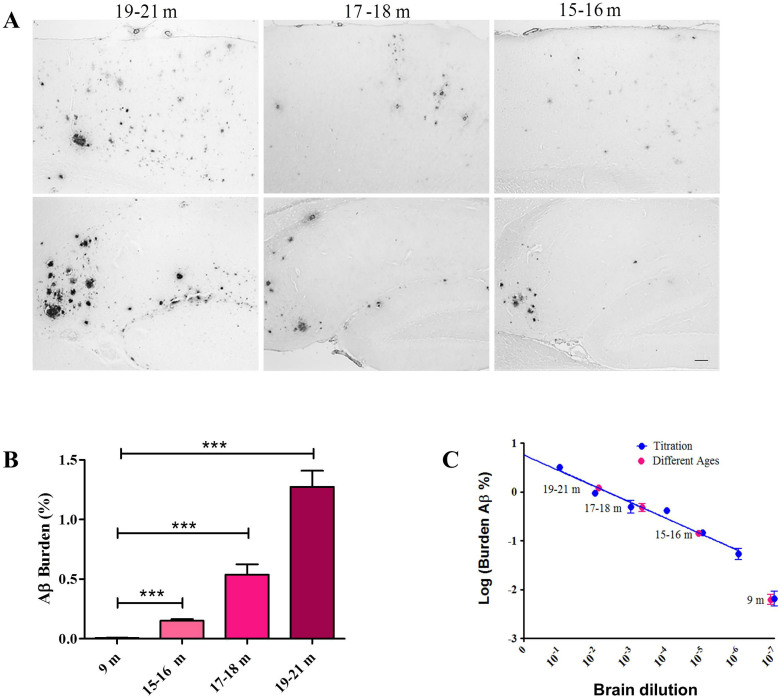
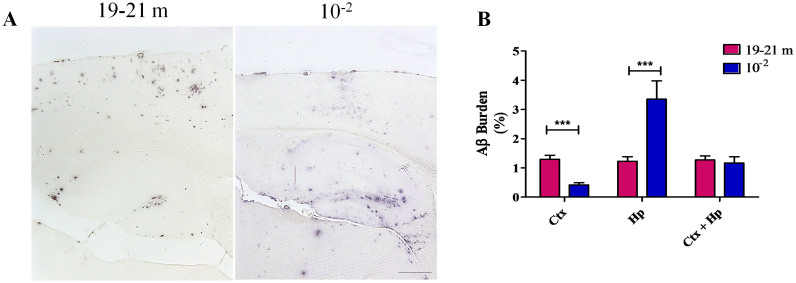
Experimental evidence in animal models suggests that misfolded Amyloid-β (Aβ) spreads in disease following a prion-like mechanism. Several properties characteristics of infectious prions have been shown for the induction of Aβ aggregates. However, a detailed titration of Aβ misfolding transmissibility and estimation of the minimum concentration of biologically active Aβ seeds able to accelerate pathological changes has not yet been performed. In this study, brain extracts from old tg2576 animals were serially diluted and intra-cerebrally injected into young subjects from the same transgenic line. Animals were sacrificed several months after treatment and brain slices were analyzed for amyloid pathology. We observed that administration of misfolded Aβ was able to significantly accelerate amyloid deposition in young mice, even when the original sample was diluted a million times. The titration curve obtained in this experiment was compared to the natural Aβ load spontaneously accumulated by these mice overtime. Our findings suggest that administration of the largest dose of Aβ seeds led to an acceleration of pathology equivalent to over a year. These results show that active Aβ seeds present in the brain can seed amyloidosis in a titratable manner, similarly as observed for infectious prions.


Figures

Figure 1
Figure 1. Experimental Strategy for injection of Aβ seeds at different concentrations in tg2576 mice.
(A) Brains from four 18–20 months old tg2576 mice harboring extensive Aβ accumulation were homogenized at 10% w/v (10−1 dilution), pooled and serially diluted 10-folds in PBS. Samples were injected intra-cerebrally into tg2576 mice as described in Methods. (B) Timeline describing mice's age at injection and sacrifice. This figure was drawn by J.B.-A.
Figure 2
Figure 2. Characterization of the inoculum.
10% w/v homogenates were prepared from four 18–20 months old tg2576 animals and materials were pooled into a single stock. These brains carried large amounts of Aβ aggregates (A) which were also reactive to ThS (B). Pictures in (A) and (B) depict hippocampal and cortical regions of two different animals, respectively. Bars in both cases represent 100 μm. (C) The pooled tissue homogenate was subjected to a serial fractionation procedure (see Methods section) and the amount of aqueous insoluble Aβ42 or the levels of the total forms of insoluble Aβ were measured and compared to brains from young transgenic mice (9 months old) displaying little aggregation. Measurements were done in duplicate and data shown as average ± standard error of the mean.
Figure 3
Figure 3. Dose-dependent acceleration of cerebral amyloid pathology by exogenous administration of Aβ seeds.
Tg2576 mice were injected with different dilutions (10−1 to 10−7) of a brain homogenate containing large amounts of Aβ seeds. Animals were sacrificed at 285 days old and amyloid burden in cortex (Ctx) and hippocampus (Hp) was measured as described in Methods. (A) Representative pictures of cortex and hippocampus of non-treated- and treated-mice injected with different dilutions of the inoculum or the vehicle (PBS). Numbers at the top-left of each picture represent dilution regarding the brain. Bar at the low-right side of the “10−7” picture denotes 200 μm and is representative for all pictures in this panel. Aβ burden in cortex (B), hippocampus (C), or both areas combined (D) was expressed as the area stained by the 4G8 antibody versus the whole area analyzed, and expressed as a percentage. The statistical analysis of this data, including the exact P value is included in Table 1.
Figure 4
Figure 4. Absence of Aβ accumulation in animals injected with high concentration of Aβ seeds and sacrificed at short time points.
Tg2576 animals injected with a highly concentrated inoculum (10−1) were sacrificed at 21- (A, C; n = 5) or 230-days (B, D; n = 6) after injection (76- or 285-days old, respectively). Pictures are representative of animals in both groups. (C) and (D) are amplifications of the areas depicted in (A) and (B), respectively. Lines at the bottom-left of pictures are representative of 100 μm (panels A and B) and 50 μm (panels C and D).
Figure 5
Figure 5. Spontaneous Aβ pathology in aged tg2576 mice.
(A) Representative pictures of cerebral cortices (upper panels) and hippocampi (lower panels) of non-treated tg2576 mice sacrificed at different time points. Black line at the lower right panel represents 100 μm and is representative for all pictures in this figure. (B) Cortical and hippocampal Aβ burden in animals sacrificed at the designated time points. (C) The logarithm of Aβ burden in animals injected with different dilutions of brain homogenate (blue dots, data obtained from Table 1) was plotted versus the dilution of the inoculum administered. A linear correlation was observed (blue line, r2 = 0.9672). The data of the logarithm of Aβ burden in non-treated animals sacrificed at different time points (pink dots) was added to the graph to facilitate the comparison with the “Aβ titration curve”. For this purpose the dots were put in the line at the experimentally obtained Aβ burden (y-axis), except for the case of 9 months old animals in which the Aβ burden was outside the regression curve. Data in (C) is expressed as averages ± SEM. Data obtained in animals injected with the 10−7 inoculum dilution was not considered in the linear regression. 10, 9 or 10 mice were used in the 15–16, 17–18 or 19–21 months groups, respectively.
Figure 6
Figure 6. Differential brain distribution of Aβ deposits in amyloid treated and aged tg2576 mice.
(A) Representative 4G8 stained brain slices from a non-treated animal sacrificed at 19–21 months old (left) and a mice injected with Aβ aggregates (10−2 inoculum dilution) and sacrificed at ~9,5 months old (285 days). Black horizontal line at the bottom of the right picture represents 150 μm and applies to both pictures. (B) Aβ burden in cortex (Ctx), hippocampus (Hp) and both areas together in mice from the groups mentioned in (A). Results are represented as means ± SEM. ***p < 0.01.

References

    1. Mucke L. & Selkoe D. J. Neurotoxicity of amyloid beta-protein: synaptic and network dysfunction. Cold Spring Harb. Perspect. Med. 2, a006338 (2012). - PMC - PubMed
    1. Cleary J. P. et al. Natural oligomers of the amyloid-beta protein specifically disrupt cognitive function. Nat. Neurosci. (2004). - PubMed
    1. Takahashi R. H. et al. Oligomerization of Alzheimer's beta-amyloid within processes and synapses of cultured neurons and brain. J. Neurosci. 24, 3592–3599 (2004). - PMC - PubMed
    1. Schenk D., Basi G. S. & Pangalos M. N. Treatment strategies targeting amyloid beta-protein. Cold Spring Harb. Perspect. Med. 2, a006387 (2012). - PMC - PubMed
    1. Klein W. L. Synaptotoxic amyloid-beta oligomers: a molecular basis for the cause, diagnosis, and treatment of Alzheimer's disease? J. Alzheimers. Dis. 33 Suppl 1, S49–S65 (2013). - PubMed

Publication types

Substances