

Review
doi: 10.1186/s13054-015-0776-1.
Starling curves and central venous pressure
Affiliations
- PMID: 25880040
- PMCID: PMC4329649
- DOI: 10.1186/s13054-015-0776-1
Item in Clipboard
Review
Starling curves and central venous pressure
Crit Care.
.
Abstract
Recent studies challenge the utility of central venous pressure monitoring as a surrogate for cardiac preload. Starting with Starling's original studies on the regulation of cardiac output, this review traces the history of the experiments that elucidated the role of central venous pressure in circulatory physiology. Central venous pressure is an important physiologic parameter, but it is not an independent variable that determines cardiac output.
Figures
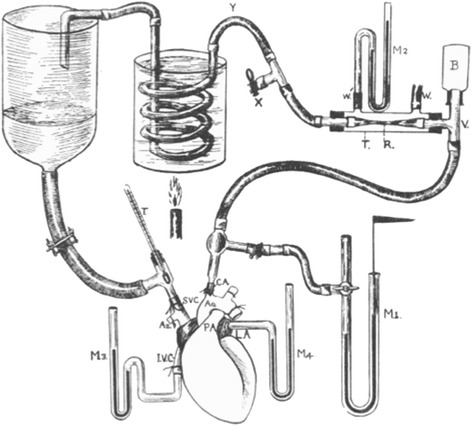
Starling’s heart–lung preparation. The coronary and pulmonary circulations are left intact and the lungs are not shown. Image reproduced with permission from [1].
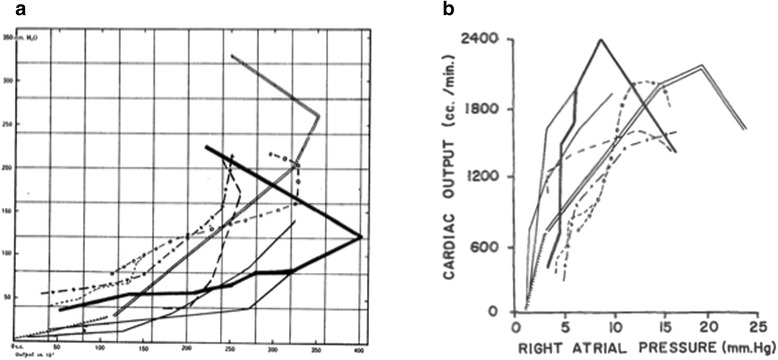
Original presentation and reproduction of the Starling curve. (a) Original presentation of the Starling curve. The y axis is right atrial pressure (mmH2O). The x axis is cardiac output (cm3/minute). Image reproduced with permission from [1]. (b) Reproduction in Guyton and colleagues’ textbook on circulatory physiology. Image reproduced with permission from [9].
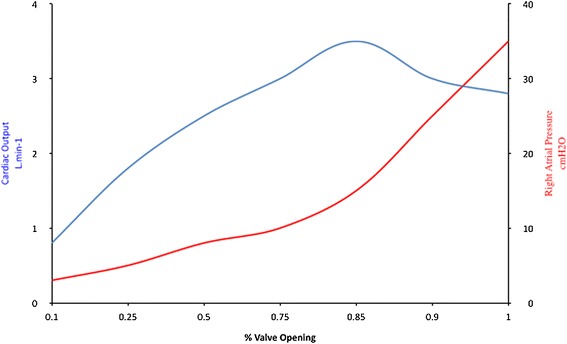
Alternative presentation of the Starling curve. Alternative presentation of the Starling curve with the actual independent variable (opening of the venous return valve) on the x axis. The original raw data from the experiments is unavailable.

Sarnoff’s curves. The atrial pressures reflect filling in these experiments. L.V., left ventricular; R.V., right ventricular. Image reproduced with permission from [12].
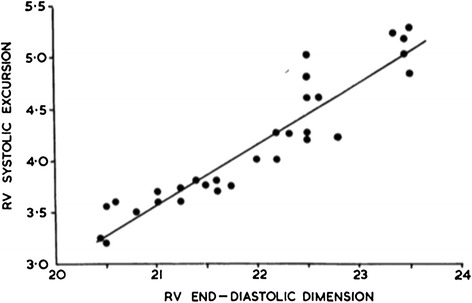
Ventricular excursion varying directly with filling by negative pressure inspiration. RV, right ventricular. Image reproduced with permission from [15].
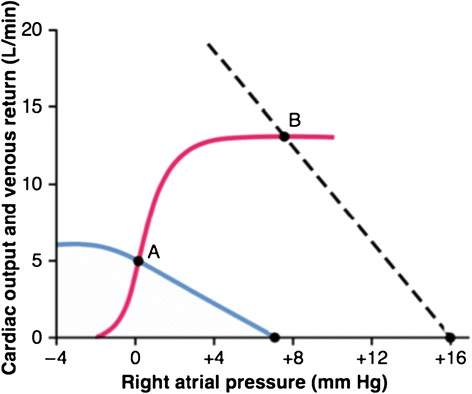
Guyton’s combination of two curves to model the circulation. The intersection of the red cardiac performance and blue venous return curves determines cardiac output. Point A is the normal rest situation. Cardiac output is higher when the dashed line is the venous return curve and intercepts the same cardiac performance curve at point B. Image reproduced with permission from [30].
References
Publication types
MeSH terms
LinkOut - more resources
Full Text Sources
Other Literature Sources
