

The quantitative methods boot camp: teaching quantitative thinking and computing skills to graduate students in the life sciences
- PMID: 25880064
- PMCID: PMC4399943
- DOI: 10.1371/journal.pcbi.1004208
The quantitative methods boot camp: teaching quantitative thinking and computing skills to graduate students in the life sciences
Abstract
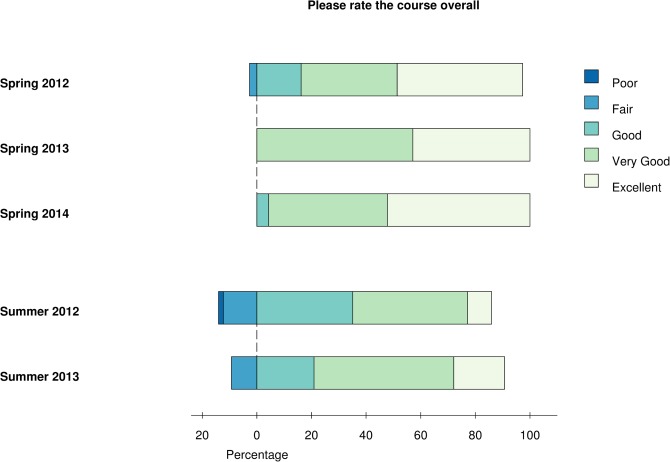
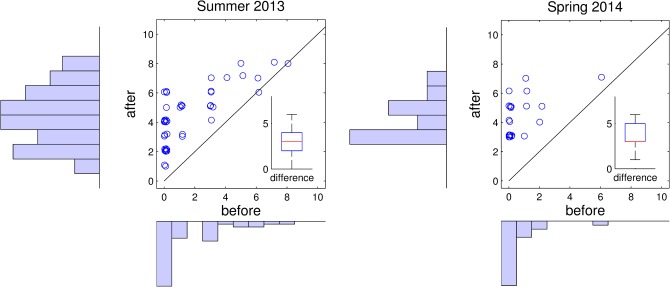
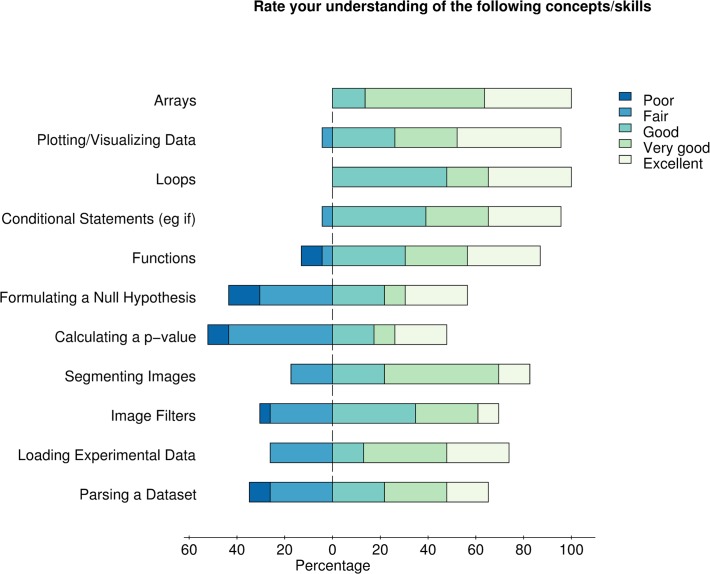
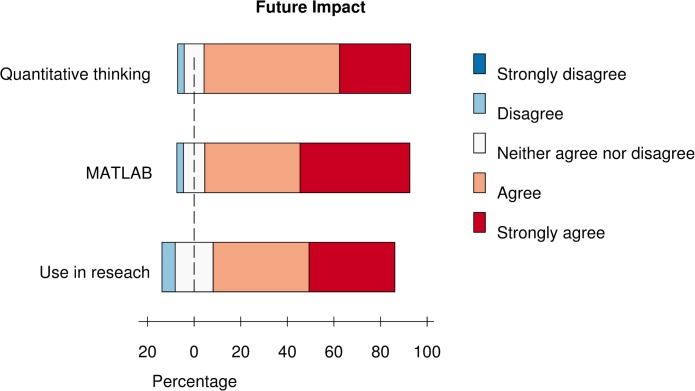
The past decade has seen a rapid increase in the ability of biologists to collect large amounts of data. It is therefore vital that research biologists acquire the necessary skills during their training to visualize, analyze, and interpret such data. To begin to meet this need, we have developed a "boot camp" in quantitative methods for biology graduate students at Harvard Medical School. The goal of this short, intensive course is to enable students to use computational tools to visualize and analyze data, to strengthen their computational thinking skills, and to simulate and thus extend their intuition about the behavior of complex biological systems. The boot camp teaches basic programming using biological examples from statistics, image processing, and data analysis. This integrative approach to teaching programming and quantitative reasoning motivates students' engagement by demonstrating the relevance of these skills to their work in life science laboratories. Students also have the opportunity to analyze their own data or explore a topic of interest in more detail. The class is taught with a mixture of short lectures, Socratic discussion, and in-class exercises. Students spend approximately 40% of their class time working through both short and long problems. A high instructor-to-student ratio allows students to get assistance or additional challenges when needed, thus enhancing the experience for students at all levels of mastery. Data collected from end-of-course surveys from the last five offerings of the course (between 2012 and 2014) show that students report high learning gains and feel that the course prepares them for solving quantitative and computational problems they will encounter in their research. We outline our course here which, together with the course materials freely available online under a Creative Commons License, should help to facilitate similar efforts by others.
Conflict of interest statement
The authors have declared that no competing interests exist.
Figures
References
-
- Steen LA. The ‘Gift’ of Mathematics in the Era of Biology In: Steen LA, editor. Math and Bio 2010: Linking Undergraduate Disciplines. Washington DC: Mathematical Association of America; 2005. p. 13–25.
-
- On Undergraduate Biology Education to Prepare Research Scientists for the 21st Century NRCUC, et al. BIO2010: Transforming undergraduate education for future research biologists. National Academies Press; (US: ); 2003. - PubMed
-
- Brewer CA, Smith D. Vision and change in undergraduate biology education: a call to action American Association for the Advancement of Science, Washington, DC: 2011.
-
- Windish DM, Huot SJ, Green ML. Medicine residents’ understanding of the biostatistics and results in the medical literature. JAMA. 2007. Sep;298(9):1010–1022. - PubMed
Publication types
MeSH terms
LinkOut - more resources
Full Text Sources
Other Literature Sources
Miscellaneous
